Improvement
Your marketing templates now show a daily performance graph
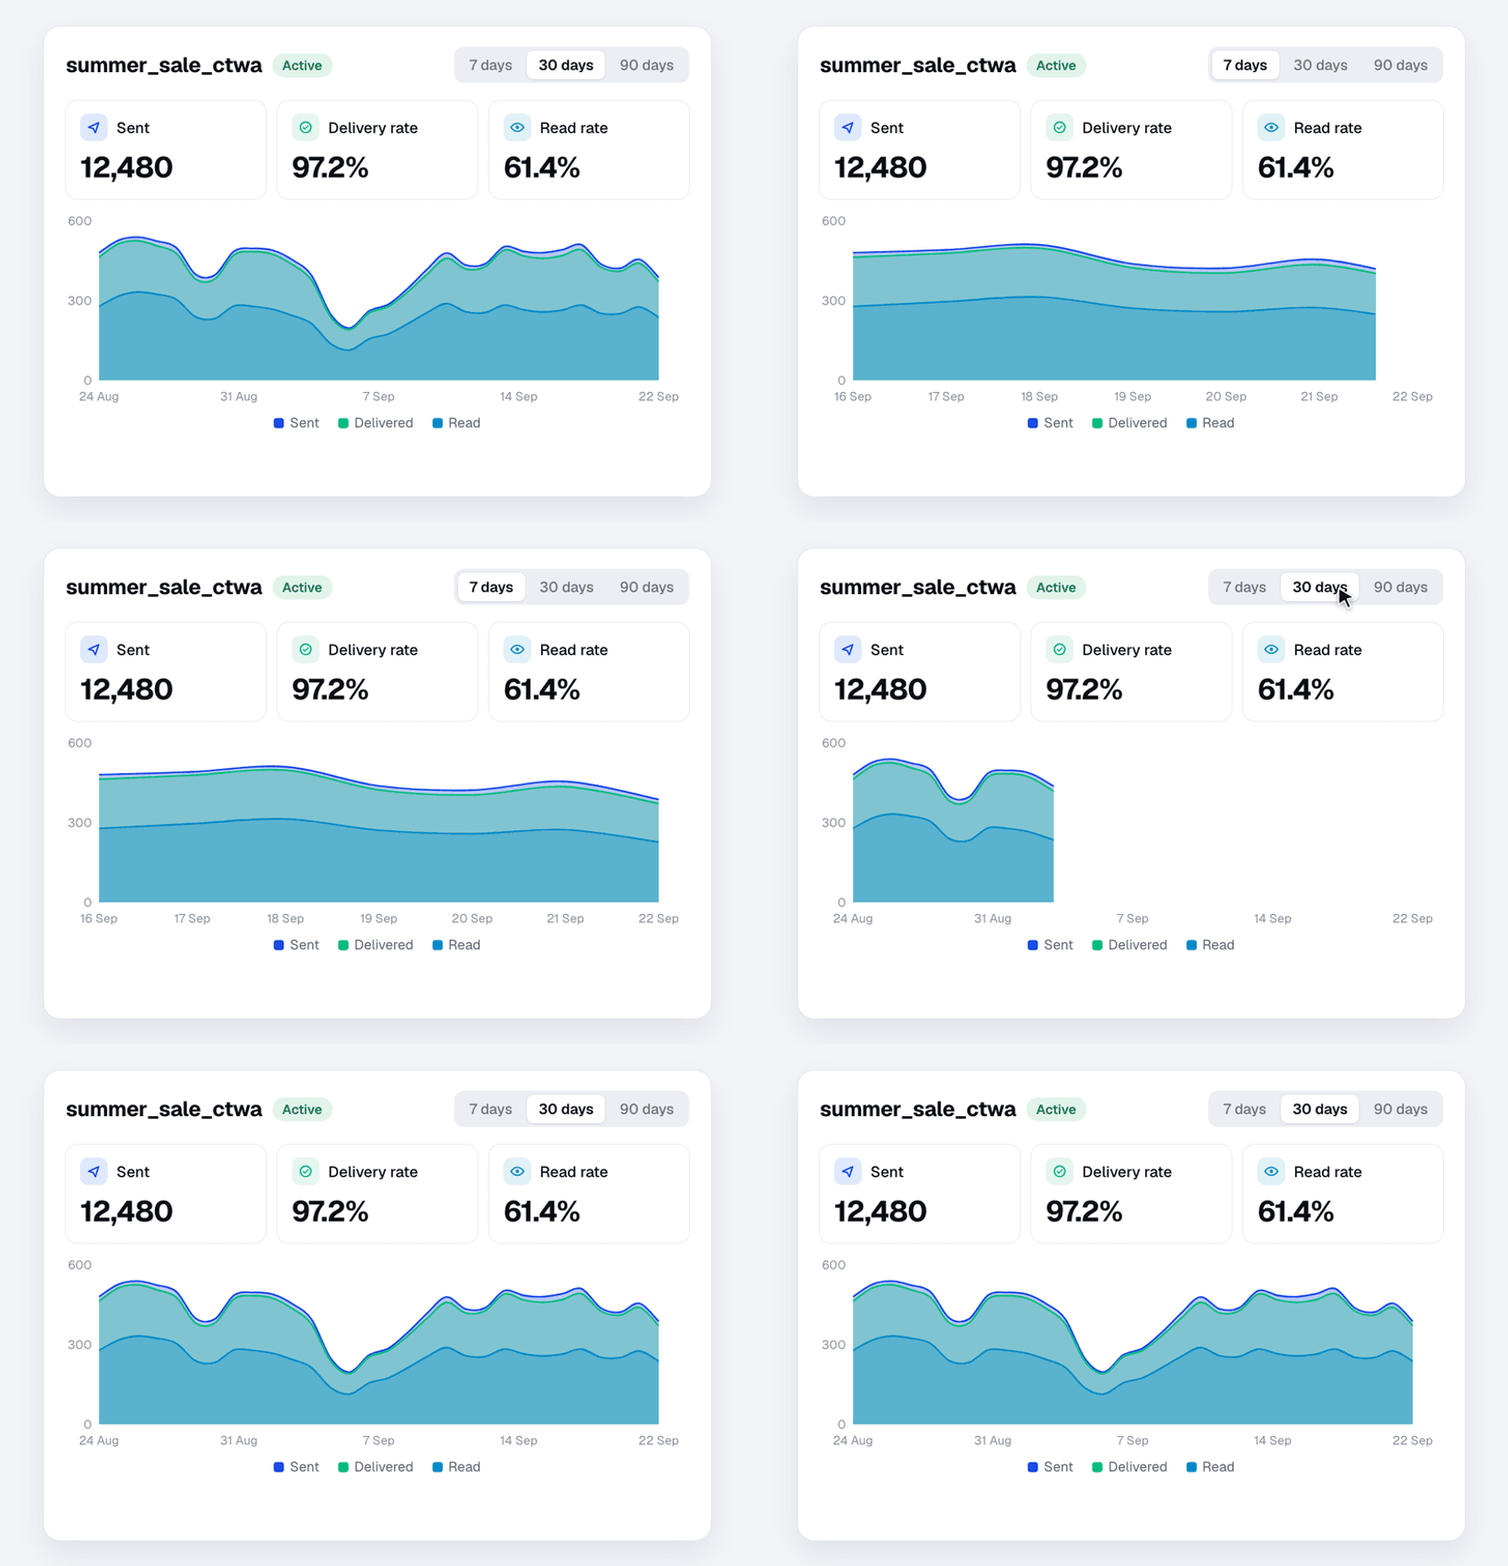
Every marketing template now shows a day-by-day graph of sent, delivered and read messages.
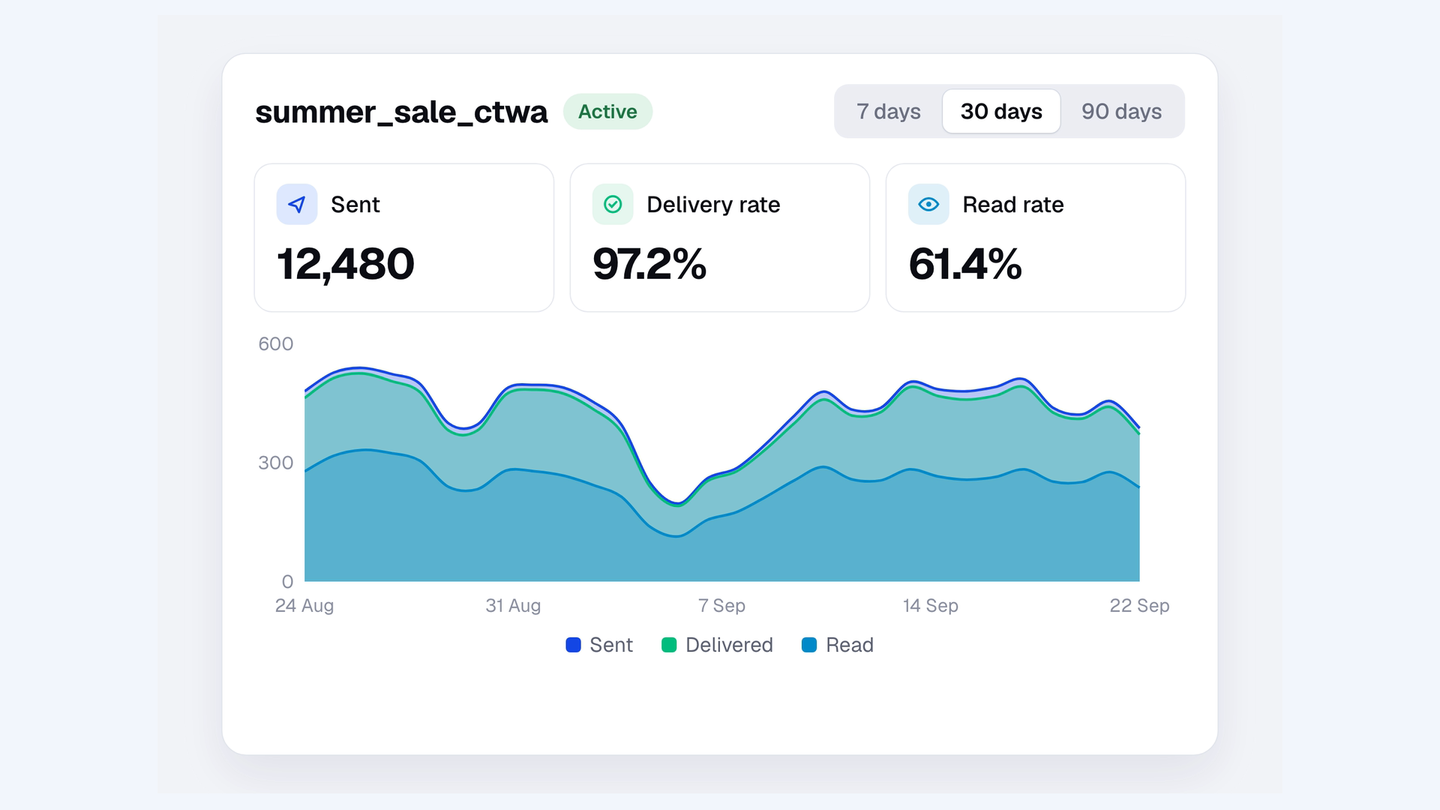
Some marketing templates showed their totals at the top of the page but an empty graph underneath.
The graph now fills in day by day over 7, 30 or 90 days, so you can see how a campaign is trending, not just where it ended up. Deliveries and reads keep arriving for a few days after a send, so a campaign often shows a tall spike on the send day and a tail after it.