
How to Calculate CSAT Score: A Step-by-Step Guide

Discuss with AI
Get instant insights and ask questions about this topic with AI assistants.
💡 Pro tip: All options include context about this blog post. Feel free to modify the prompt to ask more specific questions!
Calculating your CSAT score is refreshingly simple. You just take the number of happy customers (those who gave you a 4 or 5 on a 5-point scale), divide that by the total number of survey responses you received, and then multiply by 100. The result is a clean percentage that gives you an immediate pulse on customer happiness.

Before we get bogged down in formulas and industry benchmarks, let's get a real feel for what a Customer Satisfaction (CSAT) score actually is. Think of it as a snapshot—a real-time picture of how your customer feels right after a specific interaction. This isn't about their overall loyalty or long-term relationship with your brand. It’s about their immediate reaction after a support call, a recent purchase, or trying out a new feature for the first time.
That "in-the-moment" quality is exactly what makes CSAT so useful. It creates a direct feedback loop, letting your team see what’s landing well and, just as importantly, what’s causing friction. A high score can be a great validation for a new process you’ve rolled out. On the flip side, a sudden drop can be the first red flag that a brewing problem needs your immediate attention.
Ever since the early 2000s, businesses have leaned on these simple rating scales to gauge satisfaction. The standard method for how to calculate a CSAT score has become a cornerstone of customer experience management across the globe.
Let's break it down with a quick example. On the typical 5-point scale, only responses of 4 (satisfied) and 5 (very satisfied) are counted as positive outcomes. Imagine you get 100 total responses. If 30 people rated you a 4 and another 20 gave you a 5, the math looks like this: (30 + 20) / 100. That gives you a 50% CSAT score. For a deeper dive, you can find more CSAT calculation insights from SurveySensum.
CSAT is all about capturing in-the-moment sentiment. It’s your go-to metric for understanding the immediate impact of a single experience, giving you actionable data to make quick improvements.
For those who want a quick reference, here's a simple table breaking down the core parts of the calculation.
| CSAT Calculation Quick Answer | | :--- | :--- | | Component | What It Is | | Satisfied Customers | The count of respondents who chose the top two positive ratings (e.g., 4 or 5). | | Total Responses | The total number of survey responses received for that specific interaction. | | Formula | (Number of Satisfied Customers / Total Number of Survey Responses) x 100 |
This simple formula gives you a powerful tool for pinpointing feedback at critical stages of the customer journey.
This targeted approach lets you zoom in on specific touchpoints to see how each one is performing. You stop guessing and start getting concrete answers to crucial questions.
- After a Support Ticket: Did the agent actually solve the problem?
- Following a Purchase: How smooth and painless was the checkout process?
- During Onboarding: Are new users finding the product easy to get started with?
By measuring these specific moments, you get the hard data you need to build a customer experience strategy that truly works.

The real magic of the Customer Satisfaction (CSAT) score lies in its simplicity. It’s designed to do one thing really well: measure how many of your customers are genuinely happy. The standard formula intentionally focuses only on the positive feedback—specifically, anyone who gives you a 4 (“Satisfied”) or a 5 (“Very Satisfied”) on the typical five-point scale.
You might wonder, what about everyone else? While scores of 1, 2, or 3 are valuable for digging into problems, they don't belong in the CSAT calculation. Including them would dilute the metric. CSAT is all about getting a clean, straightforward percentage of your satisfied customers.
Here’s the formula in its most basic form:
(Total Number of Satisfied Customers / Total Number of Survey Responses) x 100 = Your CSAT Score %
This gives you an immediate pulse check on customer sentiment. It directly answers the question: "What percentage of our customers left this interaction feeling good about it?"
Let's see how this works in practice. Say you run an e-commerce store and just rolled out a new live chat feature. To see how it's landing with customers, you send a quick one-question survey after every chat ends. In the first week, you get 250 responses.
Here's the breakdown of those responses:
- 120 people gave a 5 (Very Satisfied)
- 60 people gave a 4 (Satisfied)
- The other 70 people rated the chat a 3 or lower
First, we need to find our total number of "satisfied customers." We just add the 4s and 5s together:
120 + 60 = 180 satisfied customers
Now, we plug that number into the formula:
(180 satisfied customers / 250 total responses) x 100 = 72%
Just like that, your team has a clear benchmark. A 72% CSAT score for the new feature is a solid starting point for measuring its success over time.
This 5-point scale has become a global standard for a reason—it’s adaptable and easy to understand. A software company might use it after a major update. If they get 1,500 survey responses and 980 of them are positive, their math is simple: (980 ÷ 1,500) × 100 = 65.3%. This gives them a clear signal on how the update was received. This straightforward approach is precisely why so many businesses rely on it, as you can read more on how Fullview explains this popular method.
While the standard percentage formula is the industry workhorse for calculating CSAT, it's not the only way to slice the data. Sometimes, digging a little deeper with a different method can reveal nuances in customer sentiment that the high-level percentage might miss. This is especially true when you're tracking small, incremental improvements.
One of the most common alternatives is the average score method. Instead of just counting the "satisfied" crowd (those who rated you a 4 or 5), this approach calculates the simple average of all numerical ratings.
You just add up every single score you received and divide that total by the number of people who responded. For instance, if 20 customers gave you ratings that added up to 80, your average score would be a solid 4 out of 5. It’s a great technique for spotting subtle shifts in the overall mood of your customer base.
So, which one should you use? Honestly, it depends entirely on what you're trying to learn. The standard percentage gives you a clear, powerful headline: "What percentage of our customers are happy?" On the other hand, the average score gives you a more granular feel for the overall temperature of your entire respondent pool, including the neutral and unhappy folks.
The real difference is what they spotlight. The standard formula zooms in on your happy customers and promoters. The average score method gives you a broader temperature check of every single person who replied. One isn't inherently better; they just answer different business questions.
To help you decide which approach fits your goals, here’s a quick side-by-side comparison.
Aspect Standard Method (Percentage) Average Score Method Formula (Number of Satisfied Customers / Total Responses) x 100 Sum of All Scores / Total Number of Responses Best For Getting a clear, high-level snapshot of happy customers. Tracking small, incremental changes in overall sentiment over time. Key Insight Answers: "How many of our customers are truly satisfied?" Answers: "What is the overall satisfaction level across all customers?" Focus Isolates the most positive responses (e.g., scores of 4 and 5). Includes every response, giving weight to neutral and negative feedback.
While you'll see both methods out in the wild, the percentage approach is by far the most dominant. Some companies do use the average score, but the risk is that it can sometimes mask the real number of genuinely satisfied customers. It's telling that around 85% of major international companies stick with the standard percentage method for its clarity and how easily it compares across industries. If you're curious, you can discover more insights about CSAT methodologies from Retently.
This chart is a perfect example of why the percentage method is so popular. It shows two different scenarios and how the final CSAT score immediately tells a story.
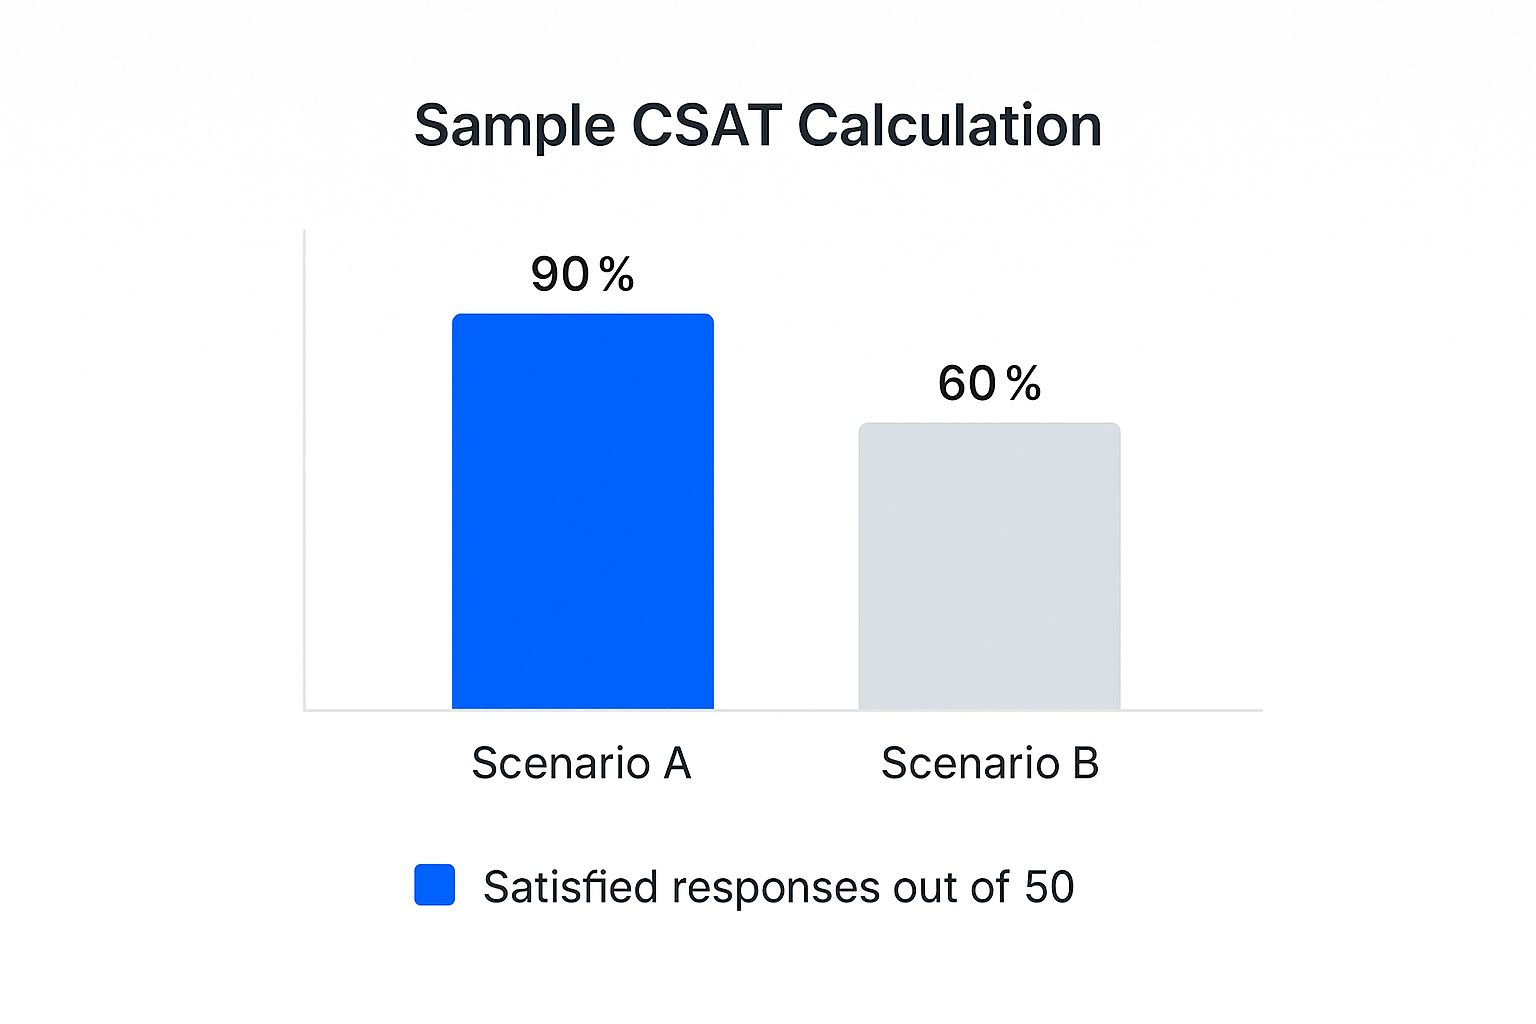
The visual gap between Scenario A's 90% and Scenario B's 60% is impossible to ignore. It instantly flags a major drop in satisfaction that demands attention, which is exactly what a good metric should do.

Getting your CSAT score is the easy part. The real work begins when you start figuring out what that number actually means for your business. Once you’ve calculated your score, the next move is turning that percentage into an actionable plan.
A question I hear all the time is, "What's a good CSAT score?" While there isn't one magic number that fits everyone, a healthy baseline for most industries falls somewhere between 75% and 85%.
But context is everything. A 75% score might be fantastic for a telecommunications company where interactions can be complex, but it could be just so-so for a beloved local coffee shop. The goal isn't just to hit some generic industry benchmark; it's to understand what's good for your business and, just as importantly, for each specific customer touchpoint.
It's a classic mistake to get fixated on a single, static score. That number is just one data point at one moment in time. The true value emerges when you start tracking its trend over time. A score that climbs from 70% to 78% over a single quarter tells a much more compelling story than a flat 80%.
When you track the trend, you can:
- Validate your improvements. Did that new checkout process you rolled out actually make customers happier? A rising score is your proof.
- Spot problems early. A sudden dip in CSAT after support interactions can be an early warning that a new process is failing or an agent needs more coaching.
The most powerful way to use your CSAT score is to watch how it moves. A positive trend confirms your strategies are working, while a negative one gives you a clear signal to investigate what’s going wrong.
This kind of continuous monitoring turns your CSAT score from a simple grade into a dynamic diagnostic tool. By watching these trends, you can connect customer feedback directly to your business operations. For instance, if you notice satisfaction dropping right after product delivery, you know it's time to look into your shipping carrier or your packaging.
This feedback loop is absolutely critical for refining your customer experience. In fact, it's a core piece of many successful service strategies. For a deeper look at building a responsive support system, check out our guide on help desk best practices. This approach helps you put your resources where they’ll make the biggest difference in customer happiness.
The quality of your CSAT score is only as good as the data you collect. If your survey process is shaky, you can't trust the results, which makes it impossible to know how customers really feel. A great score means nothing if it’s built on bad data.
The single most important factor? Timing. CSAT is all about capturing "in-the-moment" satisfaction. The experience has to be fresh, so you need to send that survey immediately after the interaction. Don't wait a week to ask about a support ticket—send it the second the case is closed.
Just as critical is how you phrase the survey question. It needs to be simple, clear, and totally neutral. You have to avoid leading language that might nudge customers toward a certain answer. A direct question like, “How satisfied were you with your recent support interaction?” works perfectly.
The goal isn't just getting a response; it's getting an honest response. Clean, unbiased data is the only way to get a meaningful CSAT score you can actually use to make decisions.
How you deliver the survey matters just as much. You want to maximize your response rate without annoying your customers. Different channels are better suited for different moments:
- In-App or On-Site Pop-ups: These are perfect for getting instant feedback right after a key action, like a customer completing a purchase or trying a new feature.
- Email: A solid and reliable choice for follow-ups after an interaction is complete, like once a support ticket is resolved or a product has been delivered.
- SMS: Great for quick, simple check-ins, especially when the customer is already interacting with you on their phone.
The scale you use is another piece of the puzzle. You have options, but there's a reason the 5-point scale (from "Very Unsatisfied" to "Very Satisfied") is the industry standard. It gives customers enough room to be specific without overwhelming them with too many choices. A 3-point scale can be too blunt, while a 7-point scale often just causes confusion.
Ultimately, collecting trustworthy data is the first step toward real improvement. For more on turning that feedback into action, our guide on analyzing customer feedback will help you connect the dots. And remember, a tool like Spur can automate this entire process, ensuring your surveys are sent at just the right moment, every time.
When you start digging into CSAT, the same questions tend to pop up. Getting these sorted out early on helps your team use this metric with confidence right from the get-go. Let's clear up some of the most common ones I hear.
Timing is everything. For the most honest and accurate feedback, you need to send your CSAT survey immediately after a specific interaction has wrapped up. This is what we call a transactional CSAT.
Think about it: the experience needs to be fresh. The perfect time is the moment a support ticket is closed or right after a customer finalizes a purchase. Any delay, and you risk the memory fading or getting mixed up with other experiences.
You’ll see a few different rating scales out there, like 3-point or even 7-point versions. But from my experience, the 5-point scale is the gold standard for a reason.
It ranges from "Very Unsatisfied" to "Very Satisfied," a spectrum most people instantly understand. This scale gives you enough nuance to work with but doesn't overwhelm the customer with too many choices, which can lead to them just abandoning the survey.
This is the million-dollar question, and the honest answer is: it depends. A "good" CSAT score really varies by industry. Across the board, a score between 75% and 85% is generally seen as pretty solid.
But context is key. An internet provider might be thrilled with a 65%, while a beloved local restaurant might aim for 90% or higher.
The smartest move is to benchmark against your direct industry competitors and, more importantly, focus on improving your own score over time. A rising trend is always more meaningful than a single static number.
Focusing on your own continuous improvement is where the real value lies. It’s a direct signal of what’s working and what isn’t. A dip in your score could point to a need for better agent training or clearer communication—both are critical for effectively dealing with customer complaints before they get worse. When you track these trends, feedback stops being just data and becomes your roadmap for growth.
Ready to stop guessing and start measuring what actually matters? Spur automates the entire feedback loop, from sending perfectly timed surveys to giving you the insights you need to boost your CSAT score. See how it works by visiting https://www.spurnow.com.