How to Measure Social Media Engagement

Discuss with AI
Get instant insights and ask questions about this topic with AI assistants.
💡 Pro tip: All options include context about this blog post. Feel free to modify the prompt to ask more specific questions!
It’s time for a reality check. For too long, social media success was measured by a simple, often misleading, numbers game: how many followers you have and how many likes your posts get. But let’s be honest, those vanity metrics don’t pay the bills. True engagement isn't about passive applause; it's about building a real connection with your audience.
We need to look past the superficial and focus on interactions that show someone is genuinely paying attention.
Think about your own social media habits. A 'like' is a quick, almost subconscious tap. It's a fleeting nod of approval. But a share? That’s a whole different story. When someone shares your content, they’re essentially telling their own friends and family, "Hey, you should check this out." They are vouching for you, putting their own credibility on the line. That's a powerful endorsement.
The same goes for a thoughtful comment. It takes effort to stop scrolling, formulate a thought, and type it out. These actions signal a much deeper level of investment than a simple double-tap ever could.
The secret to truly understanding your performance lies in knowing the difference between a passive action and active engagement. It's the first real step toward measuring what actually moves the needle for your brand.
- Passive Actions: These are the easy, one-click interactions. Think likes, reactions, and video views. They show a flicker of interest, but not much more.
- Active Engagement: This is where the magic happens. We're talking about comments, replies, shares, saves, and direct messages. These actions require more thought and effort, and they're the bedrock of a strong online community.
Imagine a post with 1,000 likes but only two comments. Now, picture another post with just 200 likes but 50 genuine comments sparking a real back-and-forth. Which one is more valuable? It’s the second one, hands down. That's a conversation, not just a broadcast.
The goal isn't just to be seen; it's to be felt and remembered. Active engagement is the clearest sign that you're turning passive scrollers into a loyal community.
Social media platforms like Instagram and TikTok want to keep people on their apps for as long as possible. How do they do that? By showing them content that’s genuinely interesting and sparks interaction. Their algorithms have gotten smarter, and they now heavily favor posts that create meaningful conversations and get shared.
Here's a quick breakdown of the core engagement metrics and what they truly signify for your business. Think of this as your cheat sheet for measuring what counts.
Metric What It Measures Associated Business Goal Comments The level of conversation and community around your content. Fostering brand community and gathering audience feedback. Shares How valuable and relatable your content is to your audience. Increasing brand awareness and organic reach. Saves Your content's utility and "evergreen" value. Establishing authority and becoming a go-to resource. Link Clicks The audience's desire to learn more or take a specific action. Driving website traffic, lead generation, and sales. Mentions Organic conversation about your brand happening online. Monitoring brand health and user-generated content.
By focusing on these metrics, you’re not just chasing empty numbers; you’re building a strategy that aligns perfectly with what social media algorithms are designed to reward. This leads to better organic visibility and a much stronger impact.
This shift means brands must prioritize tracking engagement rates over simply counting followers. If you want to dive deeper, you can explore the latest social media statistics to see just how important these trends have become. Ultimately, when you build a genuine community, you win.
If you're trying to track every single social media metric out there, you're going to drown in data. I've seen it happen countless times. The secret to effective social media measurement isn't about collecting more data; it's about collecting the right data that actually tells you if you're hitting your targets.
Think of your metrics as a compass. If they aren't pointed directly at your business objectives, you’re just sailing blind. The Key Performance Indicators (KPIs) you obsess over will naturally change depending on what you’re trying to achieve with a specific campaign. The first, most critical step is to draw a clear line from your marketing goals to the numbers you track. You can get a great sense of how top marketers are connecting social media statistics to business goals to see this strategy in action.
So, let's get practical. Let’s say your main objective is brand awareness. Your entire focus is on getting your brand name in front of as many relevant eyeballs as possible. In that case, you’ll want to track KPIs that reflect this visibility.
- Primary Metrics for Awareness:
- Reach: The number of unique people who actually see your content.
- Impressions: The total number of times your content was displayed. It's a measure of exposure.
But what if your goal is lead generation? Suddenly, just being seen isn't enough. You need people to take action. Your focus immediately shifts to metrics that signal intent and a direct response from your audience.
- Primary Metrics for Lead Generation:
- Click-Through Rate (CTR): The percentage of people who didn't just see your post, but were compelled to click the link.
- Conversion Rate: The percentage of those social media visitors who followed through and completed a goal, like signing up for your newsletter.
To keep things from getting overwhelming, I find it helpful to group engagement metrics into four main buckets. Each one tells you a different part of the story about how people are interacting with your brand.
- Applause: These are the quick, low-effort acknowledgments. Think likes, reactions, and saves. They're a good sign that people approve of your content, but it's a passive form of engagement.
- Amplification: This is when your audience becomes your marketing team. Metrics like shares and retweets fit here. Amplification is a huge win because it expands your reach organically to new audiences you might not have reached otherwise.
- Conversation: This bucket is all about the dialogue you're building. We're talking about comments, replies, and direct mentions. A healthy amount of conversation is a tell-tale sign of a strong, active community.
- Economic Value: This is the finish line—connecting your social media activity directly to your bottom line. It includes metrics like social sales conversions and leads generated that came directly from a social channel.
The biggest mistake I see is brands treating all engagement as equal. A single share that brings in a new customer is infinitely more valuable than 100 likes that lead to nothing.
Let's look at how this plays out for two totally different businesses.
Business Type Primary Goal Top KPIs to Track B2B Software Company Lead Generation CTR, Conversion Rate, Cost Per Lead D2C Fashion Brand Brand Awareness Reach, Impressions, Follower Growth Rate
A B2B software company is laser-focused on getting qualified leads into its sales funnel. They'll measure the success of their content by how many clicks it drives to a webinar sign-up or a whitepaper download.
On the other hand, a new D2C fashion brand just wants to create buzz and get seen. They will pour their energy into creating stunning, shareable visuals to maximize reach and get their designs in front of the world. By tailoring your KPIs to your business model, you stop wasting time on vanity metrics and start measuring what truly matters.
It's easy to get a little dopamine hit from a post racking up likes, but let's be honest—those vanity metrics don't paint the full picture. To truly understand how your content is landing, you need to calculate engagement rates. This is what separates surface-level social media management from strategic, data-driven work. It's about understanding performance relative to the audience you actually reached.
The process isn't complicated once you break it down. It really boils down to a simple, repeatable workflow.
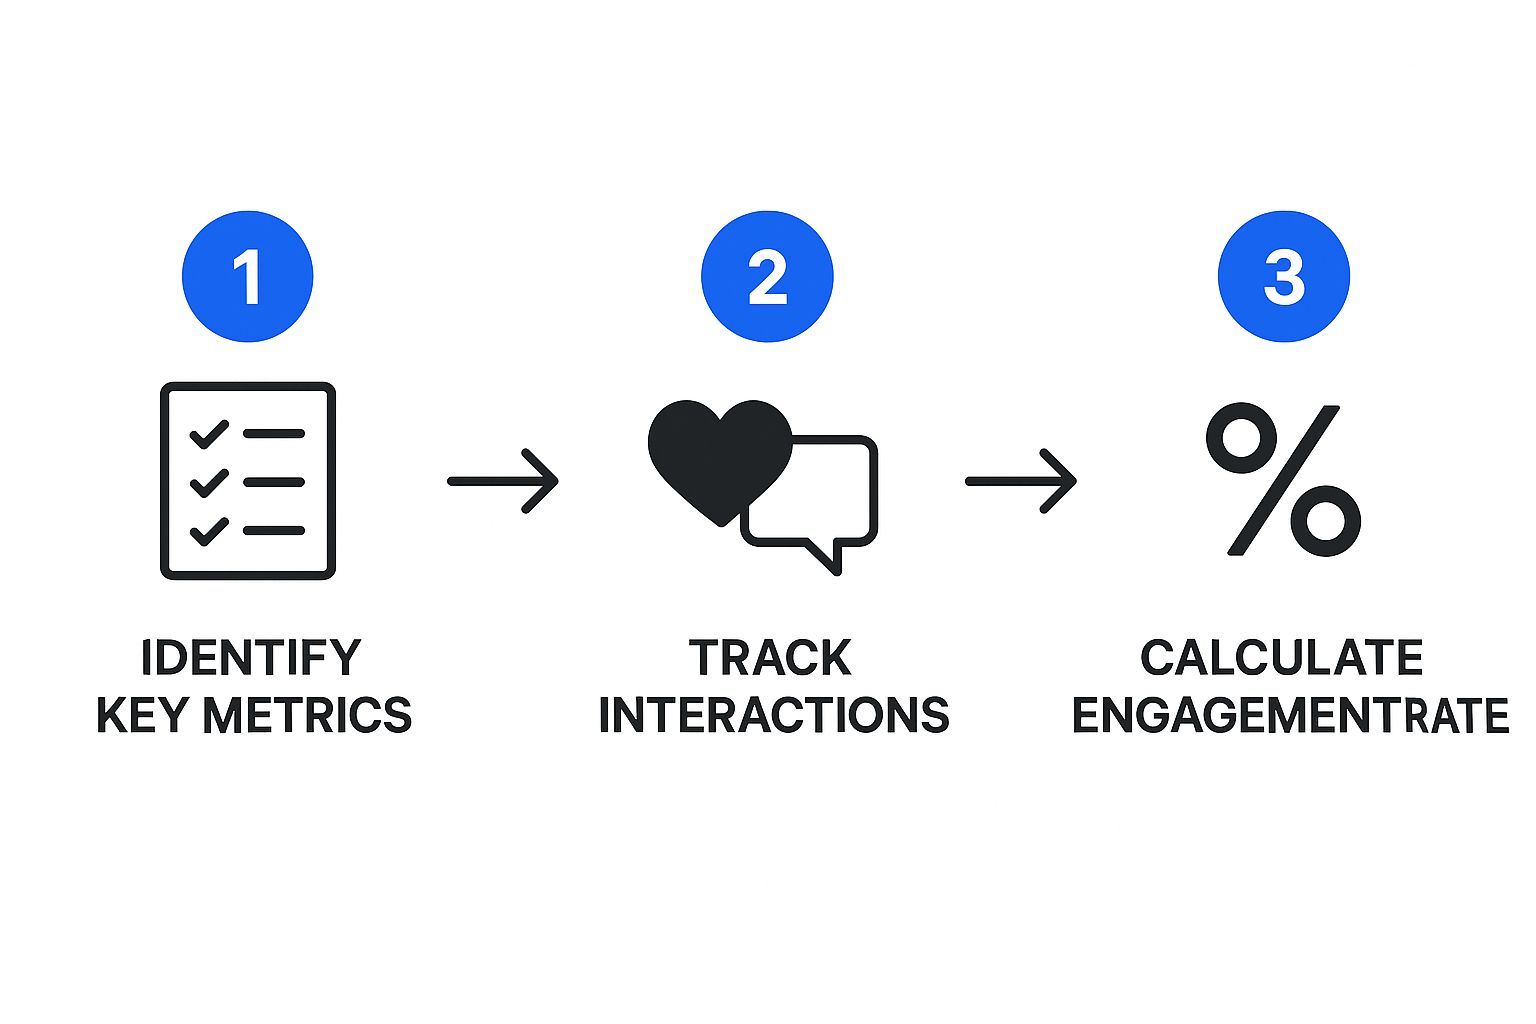
As you can see, it’s a clear path: pick the right metrics for your goal, track the specific user actions, and then run a simple calculation to get a standardized rate you can track over time.
If you ask me, Engagement Rate by Reach (ERR) is the most honest way to measure how well a single post performed. Why? Because it’s based on the number of unique people who actually saw it.
Your follower count is just a potential audience; reach is your actual audience for that specific post. Given how social media algorithms work these days, not even close to all your followers will see everything you post. This makes ERR a much more accurate reflection of your content's quality.
The formula itself is pretty simple:
(Total Engagements on a Post / Total Reach of the Post) x 100 = ERR (%)
Let’s walk through a real-world example. Say you share a new product video on Facebook.
- It gets 350 engagements (a mix of likes, comments, and shares).
- The post reached 7,000 unique people.
Plugging that into the formula: (350 / 7,000) x 100 = 5% ERR.
This 5% is a powerful piece of data. It tells you that for every 100 people who saw your video, 5 of them took an action. That’s a concrete number you can use to compare against other posts and campaigns.
Another go-to metric is the Engagement Rate per Post (ER Post). This one uses your total follower count as the base instead of reach. I'll admit, it's less precise for judging a single post's performance because, as we know, not every follower sees it.
So, why use it? It’s fantastic for getting a consistent, high-level benchmark. It helps you answer the question: "Is my content generally resonating with the community I've built?"
Here's the formula:
(Total Engagements on a Post / Total Followers) x 100 = ER Post (%)
Let's imagine you post a behind-the-scenes Reel on your Instagram account, which has 15,000 followers. That Reel earns 1,200 total engagements.
The calculation would be: (1,200 / 15,000) x 100 = 8% ER Post.
While the reach on that post might have been higher or lower than 15,000, this calculation gives you a stable baseline to track over weeks and months.
So, which one is better? It’s not about better or worse; it’s about using the right tool for the job. Your goal dictates which formula you should lean on.
- Use ERR for drilling down into the performance of individual posts or specific campaigns. It gives you the most accurate read on how compelling your content was to the people who laid eyes on it. It's my go-to for campaign reports.
- Use ER Post for tracking overall account health and consistency over time. It provides a stable metric for your monthly or quarterly reporting, helping you spot broader trends in engagement.
My personal take? You need both. I use ERR to understand what content resonates on a granular level and ER Post to monitor the general health of my audience relationship. Using them together gives you the full story—both the big picture and the important details.

Let's be honest. Trying to manually collect and crunch engagement numbers from every social channel is a recipe for disaster. You’ll spend more time drowning in spreadsheets than actually figuring out what your audience wants.
Thankfully, there are fantastic tools designed to do the heavy lifting for you. The real trick is knowing which ones to use and when to use them.
Your first line of defense should always be the free analytics dashboards built right into the social media platforms. These are packed with valuable data for understanding how your content is landing on a specific channel.
- Instagram Insights: This is my go-to for seeing how individual posts are doing. It gives you raw numbers on reach, saves, and profile visits, which is perfect for micro-level analysis.
- Facebook Business Suite: Provides a solid overview of both your Facebook and Instagram performance. It’s great for getting a handle on audience demographics and broader content trends across Meta’s ecosystem.
- TikTok Analytics: If video is your game, you need to live in here. It breaks down crucial metrics like video views, average watch time, and even where your traffic is coming from.
These native tools are brilliant for quick, platform-specific health checks. The big drawback? They exist in their own separate worlds. You can’t easily compare your TikTok growth to your Instagram performance without a whole lot of copy-pasting.
That’s where dedicated social media management platforms save the day. Tools like Sprout Social, Hootsuite, and Agorapulse are built to pull all your scattered data into one unified dashboard, giving you that much-needed bird's-eye view of your entire social media strategy.
These platforms go way beyond what the native tools can do. If you're managing influencer campaigns, especially with AI influencers, specialized dashboards like makeinfluencer.ai's analytics dashboard are designed to track that specific kind of engagement data.
The real magic of a third-party tool isn’t just seeing all your numbers in one spot. It’s about what you can do with that data once it’s consolidated. You can finally spot cross-channel patterns, identify your best-performing content pillars across the board, and build detailed reports in minutes instead of hours.
Imagine seeing, side-by-side, that while your Instagram posts get massive reach, your LinkedIn articles are actually the ones driving valuable link clicks and sparking high-quality conversations. That’s the kind of game-changing insight you get from a central hub.
This level of analysis is nearly impossible when you’re hopping between browser tabs. By plugging your channels into one system, you unlock deeper competitive analysis, sentiment tracking, and automated reporting. For a closer look at how you can put these systems to work, check out our guide on https://www.spurnow.com/blogs/social-media-automation-tools, which explains how to save time and get more powerful insights.
https://www.youtube.com/embed/jQ3kdXIzaEE
Collecting engagement data is one thing; knowing what to do with it is another game entirely. Raw numbers on a spreadsheet don't mean much on their own. The real magic happens when you start turning that data into actual strategy—transforming cold, hard numbers into insights that tell you exactly what to do next.
When you learn to interpret your social engagement data correctly, you can finally stop guessing. You'll know what your audience actually wants to see, which content pillars are hitting the mark, and why some posts take off while others fall flat.
Your first move should be to hunt for patterns. It’s tempting to obsess over a single viral post, but you need to zoom out. Look at your performance over the last month or even the last quarter.
Are videos consistently getting more shares than your beautiful graphics? Do you see a spike in comments whenever you ask a direct question in your captions? This is the start of a data-driven content audit.
By grouping your top-performing posts, you’ll quickly see which themes, formats, and tones are resonating. This isn't just interesting—it's gold. This is what you use to build your next content calendar and refine your entire approach.
Think about a direct-to-consumer brand, for example. They might notice their behind-the-scenes Instagram Reels get twice the saves of their polished, professional product shots. The insight here is clear: their audience is hungry for authenticity. The action? Make more of that human, unpolished video content.
I get asked this all the time: "Is a 2% engagement rate good?" And my honest answer is always the same: it depends.
A 2% rate on a platform like TikTok, where engagement is often sky-high, might be considered average. But for a B2B company on LinkedIn, a 2% engagement rate could be fantastic. Context is absolutely crucial.
You need to benchmark your performance against two main things:
- Your own past performance: Your most important competitor is who you were last month. Is your engagement rate trending up or down? Your number one goal should be continuous, steady improvement.
- Industry and platform averages: While it's not a perfect science, having a general idea of what's "normal" for your industry and platform gives you a valuable reality check. A quick search for social media benchmarks can give you a rough baseline.
Never look at a metric in a vacuum. A number without context is just a number. A number with context is a story that can guide your next decision.
The final piece of the puzzle is turning your analysis into reports that people can actually understand and use. This is how you show the value of your work and get the green light for new ideas and bigger budgets. A great report ties your social media engagement directly to real business goals.
Don't just list off metrics. Frame your results in the context of what the business cares about.
For instance, instead of saying, "Our reach increased by 15%," try this: "Our new content strategy boosted brand visibility by 15%, putting our message in front of 50,000 more potential customers this quarter."
This simple shift in language is how you demonstrate ROI. It's about building a compelling narrative that proves how a strong, engaged community directly contributes to the bottom line. For anyone serious about growth, mastering this kind of reporting is a key part of building an effective community engagement strategy with examples that truly sets your brand apart.
Okay, so you've got the formulas and the tools. But once you start digging into your own data, the real questions bubble up. It's one thing to know the theory, but applying it day-to-day brings a whole new set of challenges and nuances. Let's clear up some of the most common hurdles I see people run into.

Getting these details right is what separates guessing from building a truly reliable and intelligent measurement routine.
Finding the right reporting cadence is everything. You need to stay on top of things without getting bogged down in meaningless daily fluctuations. Honestly, there's no single right answer—it all comes back to your goals.
For the nitty-gritty, tactical stuff, a weekly check-in is your best friend. This is where you spot which posts are hitting the mark and which are falling flat, allowing you to make quick adjustments to your content plan.
When it's time to talk strategy or update stakeholders, a comprehensive monthly report is the gold standard. A month gives you enough data to see real trends emerge from the noise.
Then, for the high-level view, quarterly reports are perfect. This is your chance to step back and see how your social efforts are actually contributing to the bigger business objectives and to plan for the quarter ahead.
Ah, the million-dollar question. And the honest answer is always, "it depends." Chasing a universal "good" engagement rate is a fool's errand. It changes so much depending on your industry, the platform you're on, and even how big your following is.
As a very general rule of thumb, anything between 1% and 5% is usually considered pretty solid.
But here’s the real secret: Stop obsessing over a magic number. Your most important benchmark is your own past performance. The goal should always be to improve your own average rate over time.
If you absolutely need an external benchmark, look at your direct competitors. That will give you a much more realistic picture of what's achievable in your specific niche.
Video is a different beast. Likes and comments are part of the story, but they don't tell you nearly enough. Since people interact with video differently, you need to look at a different set of metrics to understand what’s really going on.
To get the full picture, you should be tracking:
- Average Watch Time: How long are people actually sticking around? This is a huge indicator of content quality.
- Audience Retention: This is often a graph showing the exact moments people are dropping off. It’s invaluable for figuring out what parts of your videos are boring your audience.
- Video Views: While each platform counts this a bit differently, it's your top-of-funnel metric for gauging initial interest and reach.
On platforms like Facebook and YouTube, don't forget about clicks on your end screens or links in the description. These are powerful signals that show your video is driving action, which is vital for using social media for lead generation.