How to Calculate Sales Revenue: Complete Guide (2025)

Discuss with AI
Get instant insights and ask questions about this topic with AI assistants.
💡 Pro tip: All options include context about this blog post. Feel free to modify the prompt to ask more specific questions!
TL;DR: Sales revenue is the total income your business earns from selling products or services before expenses. Calculate it by multiplying price per unit by quantity sold, then subtract returns and discounts. For e-commerce brands, platforms like Spur automate this tracking across WhatsApp, Instagram, and your store, giving you real-time revenue visibility while recovering abandoned carts.
If you're running a business, understanding how to calculate sales revenue isn't just accounting busywork. It's the foundation for every financial decision you'll make.
Sales revenue tells you if customers actually want what you're selling, whether you're growing, and where your money is coming from. But here's what most guides won't tell you: calculating sales revenue correctly means knowing the difference between gross and net sales, understanding when to count a sale, and (if you're in e-commerce) tracking revenue across multiple channels. Get it wrong and you'll misread your entire business health.
This guide breaks down exactly how to calculate sales revenue, with real formulas, step-by-step examples, and practical tips. Plus, if you're selling online, we'll show you how modern automation tools can automate this entirely.

Sales revenue is the money your business receives from customers in exchange for products or services over a specific period. Industry definitions describe revenue as income from business activities before your costs have been paid.
Think of it as your business's scorecard for how well your products or services are selling. It's called the "top line" because it appears at the very top of your income statement, before any expenses get subtracted.
Here's what makes sales revenue different from other income:
It only counts your core business. If you run a clothing store, sales revenue includes money from selling clothes. It doesn't include interest from your business savings account or money from selling an old delivery van. Those are "other income."
It's measured over time. You calculate sales revenue for specific periods (monthly, quarterly, annually). This lets you compare performance. For example, "Our Q4 sales revenue was $500,000" or "Year-over-year revenue grew 25%."
It comes before expenses. Sales revenue is the starting point. You haven't paid for inventory, salaries, rent, or anything else yet. That calculation comes later when determining profit.
It shows market demand. Rising sales revenue usually means more customers want your products or you're expanding your reach. Declining revenue signals it's time to investigate what's changing in your market.
For business owners, investors, and managers, sales revenue is the first metric they check. It answers the fundamental question: "Can this business actually sell things?"
Most business owners obsess over profit margins (and you should), but sales revenue deserves just as much attention. Here's why it matters so much.
It's your growth indicator. You can't improve what you don't measure. Tracking sales revenue month-over-month shows whether your business is expanding, stagnating, or contracting. If your revenue jumps 30% in Q2, you know something's working. If it drops 15%, you need to act fast.
It drives other metrics. Nearly every important business KPI connects back to revenue. Customer acquisition cost only matters when you compare it to revenue per customer. Inventory turnover makes sense when you view it against sales velocity. Marketing ROI requires knowing how campaigns impact revenue.
Investors care about it. If you ever want funding, investors will scrutinize your revenue growth above almost anything else. Consistent revenue growth signals market validation and scalability. Erratic or declining revenue raises immediate red flags.
It reveals channel performance. For e-commerce businesses especially, understanding which channels drive revenue matters enormously. Are Instagram sales growing while website sales plateau? Is WhatsApp driving more revenue than expected? You can't answer these questions without proper revenue tracking across multiple marketing channels.
It helps set realistic goals. When you know your current revenue and growth rate, you can forecast intelligently. "We did $100K last quarter and grew 10%. If we maintain that, we'll hit $133K next quarter" is a real target, not guesswork.
For modern D2C brands selling across multiple channels (your website, Instagram DMs, WhatsApp Business, marketplaces), tracking becomes even more critical. You need to know which touchpoints convert and where revenue actually originates.
At its core, calculating sales revenue is straightforward math:
Sales Revenue = Price per Unit × Number of Units Sold
If you sell one product at a fixed price, you're done. For example:
→ You sell software licenses at $100 each
→ You sold 50 licenses this month
→ Your sales revenue = $100 × 50 = $5,000
Simple enough. But most businesses sell multiple products at different prices. In that case, calculate revenue for each product and add them up:
Total Sales Revenue = (Price₁ × Quantity₁) + (Price₂ × Quantity₂) + ... + (Priceₙ × Quantityₙ)
Each Price × Quantity represents revenue from one product. Sum them all for your total.

Let's say you run a small clothing boutique and sell two items:
① T-shirts: $20 each
② Jeans: $50 each
In October, you sold:
• 100 T-shirts
• 40 pairs of jeans
Calculation:
T-shirt revenue = $20 × 100 = $2,000
Jeans revenue = $50 × 40 = $2,000
Total sales revenue = $2,000 + $2,000 = $4,000 for October
The formula works identically for services. Just treat your service as the "unit."
A consulting firm charges $200 per hour. In September, they billed 30 hours.
Revenue = $200 × 30 = $6,000
Whether you're selling physical products, digital goods, or services, the core formula stays the same: multiply what you charge by how many you sold.
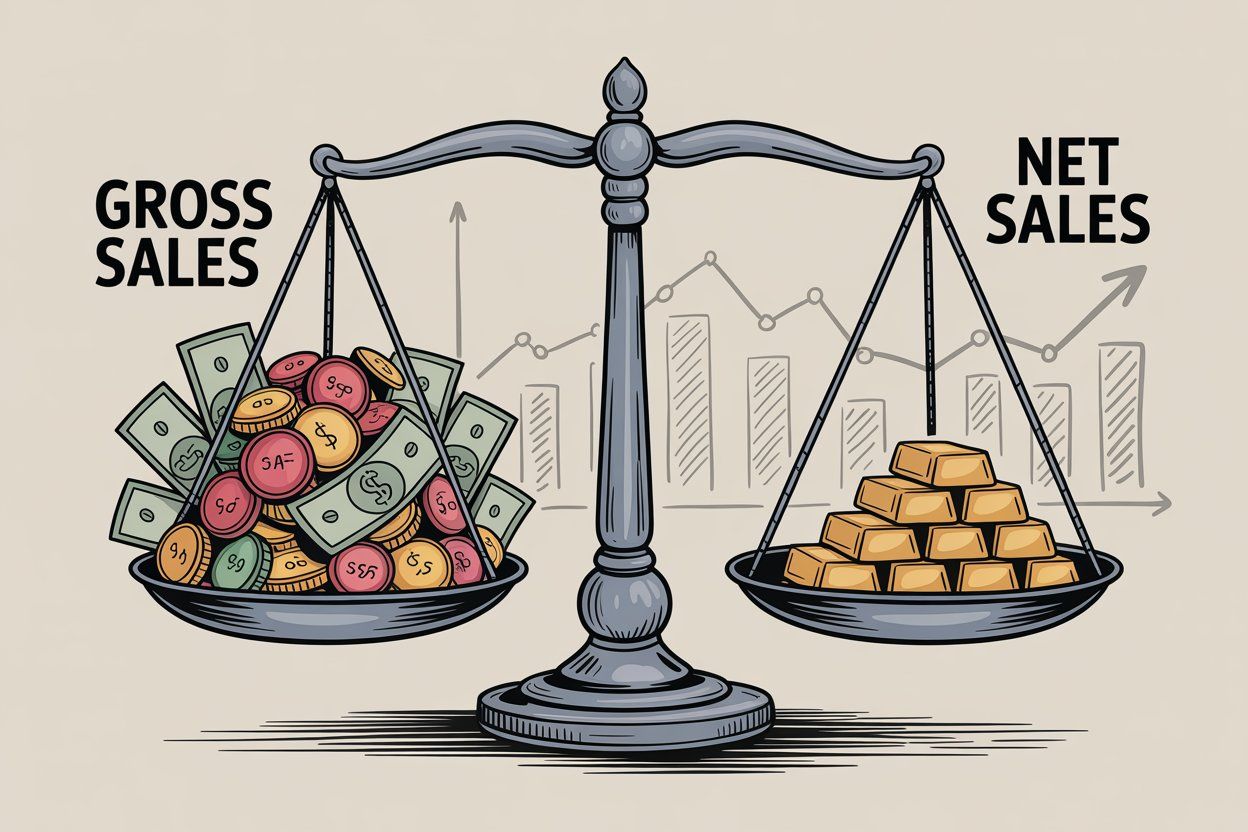
Here's where things get real. The number we just calculated ($4,000 for the boutique) is technically gross sales. But that's not the full story.
Gross sales = Total unadjusted revenue at stated prices. It's the raw sales number before any subtractions.
Net sales (net revenue) = Actual revenue after subtracting returns, refunds, allowances, and discounts.
Why does this matter? Because real businesses deal with returns, offer discounts, and sometimes reduce prices post-sale. If you only look at gross sales, you'll overestimate what you actually keep.
| Deduction Type | What It Means |
|---|---|
| Sales returns | When customers return products for refunds. That refunded amount comes off your revenue. |
| Sales allowances | Price reductions after sale due to defects or issues. The customer keeps the product but at a lower price. |
| Discounts | Early payment discounts (common in B2B), promotional discounts, or coupon codes that reduce the sale price. |
The relationship looks like this:
Net Sales = Gross Sales - Returns - Allowances - Discounts
On an income statement, returns and allowances appear as a contra-revenue line item that subtracts from gross sales. After that subtraction, you get Net Sales (often just labeled "Sales" or "Revenue" on statements).
Let's go back to our boutique with $4,000 in gross sales. Now add some reality:
• 5 T-shirts were returned (5 × $20 = $100 in refunds)
• One bulk customer got a $50 discount on a large jeans order
• Total deductions = $100 + $50 = $150
Net Sales = $4,000 - $150 = $3,850
On your income statement, it would show:
Gross Sales: $4,000
Less: Returns & Allowances: ($150)
─────────────────────────────────
Net Sales: $3,850
That $3,850 is your actual sales revenue after accounting for give-backs.
If returns or discounts make up a large chunk of your gross sales, that's a signal. High return rates might indicate product quality issues or customer dissatisfaction that needs addressing. Heavy discounting could mean your pricing strategy needs work or you're competing primarily on price.
When returns and allowances become significant relative to total sales, management should immediately investigate the underlying causes.
Let's outline a clear process you can follow every time:
① Determine Your Time Period
Decide whether you're calculating revenue for a month, quarter, year, or other period. Gather all sales data for that complete timeframe.
② Sum All Sales Transactions
Add together revenue from every sale. Few large sales? Sum them individually. Many small sales? Aggregate by product or category (total units sold × price for each SKU).
Most e-commerce platforms, POS systems, or accounting software can export this data automatically.
③ Apply the Basic Formula
Multiply units sold by their selling price for each product or service, then add everything up. This gives you Gross Sales Revenue.
④ Subtract Returns and Discounts
Calculate the total dollar amount of refunds issued, price adjustments or credits given, and discounts or coupons that reduced sale prices.
Subtract these from gross sales to get Net Sales Revenue.
⑤ Double-Check Units and Prices
Verify that the quantities and prices you used are correct for the period. Using wrong units or outdated prices throws off your entire calculation.
⑥ Ensure Consistent Units
If your prices include taxes or fees you pass to third parties (like sales tax to the government), those typically shouldn't count as your revenue. Only include the portion that actually belongs to your business.
A landscaping company wants to calculate Q1 revenue (January-March). They offer two services:
| Service | Price |
|---|---|
| Lawn Mowing | $50 per session |
| Garden Design | $500 per project |
Q1 Activity:
• Completed 120 mowing sessions
• Completed 8 design projects
Steps 1-3: Calculate gross revenue
Mowing: 120 × $50 = $6,000
Design: 8 × $500 = $4,000
Gross Revenue = $10,000
Step 4: Account for deductions
One customer complained and received a 50% refund on a $500 design = $250 refund. No other discounts given.
Net Revenue = $10,000 - $250 = $9,750
Steps 5-6: Double-check (120 sessions and 8 projects match records; prices $50 & $500 correct; refund accounted for)
The landscaping business reports Gross Sales: $10,000 and Net Sales: $9,750 for Q1.
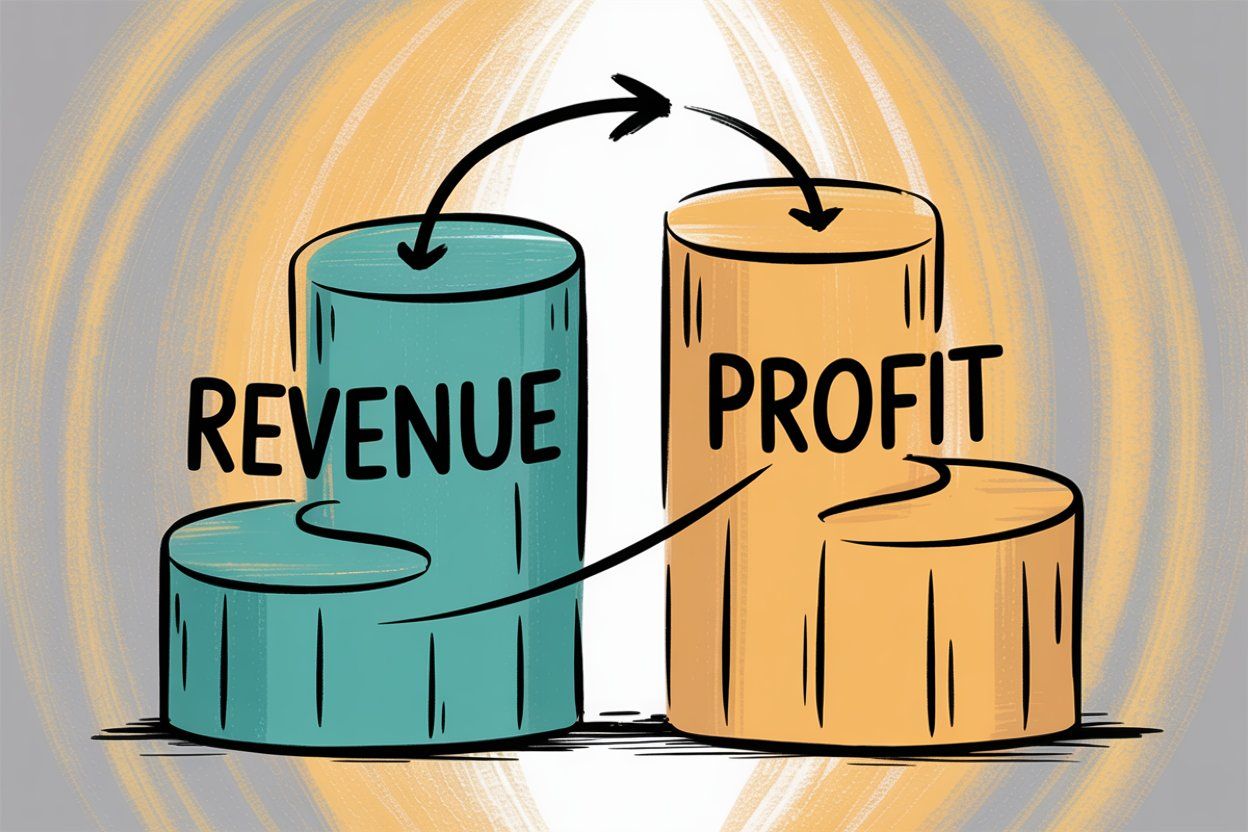
This is crucial: sales revenue is not the same as profit. Revenue shows money coming in. Profit shows money you keep after paying for everything.
Here's the breakdown:
Revenue = Money in from sales (the top line)
Expenses = Money out (inventory costs, salaries, rent, marketing, etc.)
Profit = Revenue - Expenses (the bottom line, what you actually keep)
You can have very high sales revenue and still barely scrape by (or lose money) if your costs are also high. Conversely, a company with modest revenue but extremely low costs can be highly profitable.
When calculating sales revenue, you don't deduct any costs. Those come later when calculating:
Gross profit = Sales revenue - Cost of Goods Sold (direct costs to produce goods/services)
Net profit (net income) = Sales revenue - all expenses (production, operating expenses, taxes, interest, etc.)
Our boutique had $3,850 in net sales. But let's say:
| Expense Type | Amount |
|---|---|
| Inventory cost | $2,000 |
| Rent | $1,000 |
| Staff wages | $500 |
| Total expenses | $3,500 |
Profit = $3,850 - $3,500 = $350
Despite $3,850 in revenue, the actual profit is only $350 (about 9% profit margin). High sales don't automatically mean high profit.
On the flip side, a niche business selling high-margin digital products might have $20,000 in revenue with only $2,000 in expenses (hosting, software, minimal overhead), yielding $18,000 profit (90% margin).
Key takeaway: Sales revenue measures how much you sold. Profit measures how much you earned after paying for everything. Both tell important but different stories about your business.
Let's walk through scenarios covering various business types:
You run a phone accessory shop. In 2025, you sold:
• 5,000 phone cases at $15 average price
• 2,000 portable chargers at $25 each
Calculation:
Phone cases revenue = 5,000 × $15 = $75,000
Chargers revenue = 2,000 × $25 = $50,000
Gross sales revenue = $125,000
Adjustments:
→ 100 cases returned = $1,500 in refunds
→ Holiday 10% discount on 200 chargers = 10% of ($25 × 200) = $500
Net sales revenue = $125,000 - $1,500 - $500 = $123,000
You own a small SaaS company charging clients $100/month for software access. By year-end, you have 150 active subscribers.
Monthly revenue = $100 × 150 = $15,000
Annual sales revenue = $15,000 × 12 = $180,000
(If some clients received free months or discounts, adjust for those in net sales)
Your service has two pricing tiers:
| Tier | Price | Subscribers |
|---|---|---|
| Basic | $50/month | 50 |
| Premium | $150/month | 20 |
Monthly calculation:
Basic revenue = 50 × $50 = $2,500
Premium revenue = 20 × $150 = $3,000
Total monthly revenue = $5,500
If one Premium subscriber requests a refund:
Net sales = $5,500 - $150 = $5,350
You sell widgets at $2 each wholesale. A large client orders 10,000 widgets but negotiates a 5% volume discount.
Before discount: 10,000 × $2 = $20,000
After 5% discount: $20,000 × 0.95 = $19,000
Your gross sales would have been $20,000, but net sales after discount = $19,000.

Each business model has nuances (especially around discounts and returns), but the core principle stays the same: multiply price by quantity for each sale, then adjust for any give-backs.
On the income statement (also called profit and loss statement), sales revenue is typically the first line. It might be labeled:
• "Revenue"
• "Sales"
• "Net Sales"
• "Income from Operations"
Net Sales: $3,850
Cost of Goods Sold: ($2,000)
─────────────────────────────────────
Gross Profit: $1,850
Operating Expenses: ($1,500)
─────────────────────────────────────
Operating Profit: $350
Net Sales of $3,850 (already accounting for returns/discounts) is where everything starts. From there, costs subtract down to eventually show profit.
Some companies break it out further:
Gross Sales: $4,000
Less: Returns & Allowances: ($150)
─────────────────────────────────────
Net Sales: $3,850
Financial analysts pay close attention to the net sales line and how it trends over time:
Growing sales quarter after quarter = positive sign (demand increasing)
Shrinking revenue = concern (market issues, competition, product problems)
Erratic revenue = unpredictability (harder to forecast and plan)
Understanding how to calculate sales revenue correctly ensures these financial statements accurately reflect your business performance.
Even experienced business owners sometimes get this wrong. Here are pitfalls to avoid:
Mistake 1: Including Sales Tax as Revenue
Sales taxes collected from customers get passed to the government. They're not your income.
Example: You sell an item for $100 plus $8 sales tax. The customer pays $108, but your revenue is $100, not $108. The $8 is tax liability, not income.
Mistake 2: Confusing Revenue with Profit
We covered this above, but it's worth repeating. Revenue = money from sales. Profit = money after expenses. Don't use these terms interchangeably.
Mistake 3: Wrong Time Period Attribution
Only include sales that belong to the period you're measuring. If you received an order in December but shipped in January, that sale typically counts for January's revenue (under accrual accounting).
Mistake 4: Not Accounting for Returns Properly
If a sale is refunded in the same period, subtract it from that period's revenue. If refunded later, reduce the later period's revenue. Keep meticulous records to avoid overstating revenue.
Mistake 5: Mixing Accrual and Cash Accounting
Accrual accounting: Record revenue when earned (when product/service delivered), even if you haven't been paid yet.
Cash accounting: Record revenue when cash is actually received.
Most larger businesses use accrual (so revenue aligns with deliveries). Be consistent with whichever method you choose, or your numbers will be all over the place.
Mistake 6: Inconsistent Pricing Units
If you have tiered pricing (e.g., $100 each for first 10 units, $90 each for next 10), break the calculation into parts. Don't just average the price.
Mistake 7: Currency Conversion Errors
If you do international sales in multiple currencies, convert everything to your base currency using appropriate exchange rates for the period. Inconsistent conversions skew revenue figures.
Avoid these mistakes by using reliable systems (accounting software, POS platforms, e-commerce dashboards) that handle calculations automatically and consistently.
For modern e-commerce and D2C businesses, manually calculating sales revenue across multiple channels is tedious and error-prone. You're selling through your Shopify store, taking orders via WhatsApp Business API, responding to Instagram DM inquiries, and maybe even handling live chat on your website.
This is where Spur transforms the entire process.
Spur integrates directly with platforms where your sales happen:
• Shopify: Syncs every order automatically
• WooCommerce: Tracks orders seamlessly
Payments are tracked seamlessly too:
• Stripe: Pulls transaction data
• Razorpay: Integrates payment processing for Indian merchants
When a customer completes a purchase through any connected channel, Spur automatically logs the transaction.

Spur tracks revenue across channels:
WhatsApp orders: Customers can browse your catalog and complete purchases via WhatsApp Business API, with Spur tracking every transaction.
Instagram DM sales: When someone buys after seeing your Instagram post and messaging you, Spur's Instagram automation captures that revenue source.
Live chat conversions: Sales that start with a website live chat inquiry get tracked back to that touchpoint.
This multi-channel attribution answers questions like: "How much revenue came from WhatsApp broadcasts this month?" or "Are Instagram DM leads converting better than website visitors?"
Here's a major way Spur directly increases your sales revenue: automated abandoned cart recovery.
When a customer adds items to cart but doesn't complete checkout, Spur automatically sends a WhatsApp message reminding them. These messages can include cart contents, direct checkout link, limited-time discount code, and personalized product recommendations.
Every recovered cart directly adds to your sales revenue. For many e-commerce brands, cart abandonment rates hover around 70%. Recovering even 10-15% of those abandoned carts can meaningfully impact revenue.
Eves & Gray (jewelry brand) used Spur's WhatsApp broadcasts and achieved 88.75x ROI in just 24 hours. Their targeted messaging and Spur's DeliveryBoost feature delivered nearly 99% message delivery rates.
Muffynn (fashion brand) ran a targeted WhatsApp broadcast through Spur and saw 73x ROI on that single campaign.
These are real case studies of businesses using Spur to not just track revenue, but actively increase it through automated customer engagement.

① Connect your platforms: Link your Shopify, WooCommerce, Stripe, or Razorpay account to Spur
② Set up automation: Configure abandoned cart flows, WhatsApp broadcasts, and Instagram auto-replies
③ Enable support automation: Set up AI-powered customer support to handle common queries automatically
④ Watch revenue flow: Spur tracks every sale and attributes it to the right channel
⑤ Optimize what works: See which channels and campaigns drive the most revenue
For D2C brands selling across multiple channels, Spur eliminates the manual work of calculating sales revenue while simultaneously helping you increase that revenue through smart automation.
Whether you're calculating manually or using automation, these best practices ensure accuracy:
Pull sales figures from trustworthy systems: POS systems, e-commerce platform reports, accounting software like QuickBooks or Xero.
For e-commerce businesses, platforms like Spur that integrate directly with your store eliminate data entry errors entirely through seamless e-commerce integrations.
Only include sales that actually belong to the period you're measuring. This is especially important at month-end or year-end. A sale made on December 31st might not ship until January 2nd. Depending on your accounting method, that might be January revenue.
Accrual accounting (most common): Record revenue when it's earned (when product/service is delivered), even if you haven't been paid yet.
Cash accounting: Record revenue when cash is actually received.
Most established businesses use accrual because it gives a more accurate picture of business activity. Be consistent with whichever method you choose.
Don't count as revenue:
• Sales taxes or VAT (passed to government)
• Shipping costs paid by customer and passed to carrier
• Other pass-through fees
Only the portion that actually belongs to your business counts as revenue.
Decide how you'll treat refunds and stick with it:
Same-period refunds: Subtract from that period's revenue
Later-period refunds: Reduce the later period's revenue (or record as separate expense)
Either approach works, but consistency is key for accurate period-over-period comparisons.
Double-check that prices are per single unit (or per bundle if you sell bundles). If you offer tiered pricing (first 10 units at $100 each, next 10 at $90 each), break the calculation into parts:
First tier: 10 × $100 = $1,000
Second tier: 10 × $90 = $900
Total = $1,900 (not 20 × $95)

If you sell internationally, convert all sales to your base currency using appropriate exchange rates for the period. Most accounting software does this automatically. If calculating manually, use official rates from your bank or a service like XE.com.
Don't wait until year-end to verify your numbers. Monthly reconciliation catches errors early when they're much easier to fix. Compare your calculated revenue against bank deposits, payment processor reports, and accounting software totals.
For most businesses, these terms are interchangeable. "Sales revenue" and "revenue from sales" mean the same thing: income from your core business activity of selling products or services. The term "revenue" can technically include other income (interest, investments), but when people say "sales revenue," they specifically mean income from sales.
Use the same formulas covered above, but only include sales from that specific month:
① Identify all products/services sold during the month
② Multiply each product's price by quantity sold
③ Sum all products for gross monthly sales
④ Subtract returns, refunds, and discounts from that month
⑤ Result = net monthly sales revenue
For e-commerce businesses, your platform typically has a report showing monthly revenue. Tools like Spur with integrations to these platforms provide even more detailed multi-channel revenue breakdowns.
No. Sales taxes (or VAT in some countries) collected from customers are not your revenue. They're taxes you collect on behalf of the government and must remit.
Example: Customer pays $108 ($100 item + $8 sales tax). Your revenue = $100. The $8 is a tax liability, not income.
Gross revenue (gross sales) = Total sales at stated prices before any deductions. It's the raw, unadjusted number.
Net revenue (net sales) = Gross revenue minus returns, allowances, and discounts. It's what you actually keep from sales.
Net revenue gives a more accurate picture of your real income from sales activity.
Minimum: Monthly. This helps you spot trends, seasonal patterns, and problems early.
Better: Weekly for fast-moving e-commerce businesses. Helps you react quickly to changes.
Best: Real-time dashboards. With modern tools like Spur integrated with your Shopify or WooCommerce store, you can see revenue updated continuously.
The frequency depends on your business pace and how quickly you need to make decisions.
Absolutely, and you should. Manual calculation is time-consuming and error-prone.
Most e-commerce platforms (Shopify, WooCommerce) have built-in revenue reports. Accounting software (QuickBooks, Xero) automatically tracks revenue from invoices and sales.
For businesses selling across multiple channels (website, WhatsApp, Instagram, marketplace), a unified platform like Spur consolidates everything. Spur integrates with your e-commerce platform, payment processors, and messaging channels to give you complete revenue visibility without manual data entry.
Sales revenue is the foundation for growth in several ways:
It funds operations: Revenue pays for inventory, staff, marketing, and expansion. No revenue = no resources to grow.
It attracts investment: Investors look at revenue growth as proof your business model works and scales. Consistent revenue growth (20-30%+ annually) makes you highly attractive for funding.
It validates product-market fit: Rising revenue means customers want what you're selling. Stagnant revenue suggests you need to pivot or improve.
It enables forecasting: Historical revenue trends let you project future performance and plan accordingly (hiring, inventory, marketing budget).
This varies by industry, business stage, and size, but general benchmarks:
| Business Stage | Typical Growth Rate |
|---|---|
| Early-stage startups | 100-300% year-over-year (from a small base) |
| Growth-stage companies | 30-50% annual growth |
| Established businesses | 10-20% annual growth |
| Mature companies | 5-10% for very large, established brands |
Context matters enormously. A local bakery growing 10% annually in a stable market is doing great. A VC-backed tech startup growing 15% might be struggling.
Compare yourself to your industry benchmarks and focus on sustainable growth that maintains profitability.

Now that you understand how to calculate sales revenue correctly, you have the foundation for every important business decision.
Sales revenue isn't just a number for your accountant or tax returns. It's your business's vital sign. Track it consistently, understand what drives it, and use those insights to grow.
Revenue tells you what's working. If revenue from Instagram sales doubled after you started using Spur's Instagram automation, you know that channel deserves more investment.
Revenue reveals problems early. If revenue drops 15% in a month, you can investigate immediately. Did a competitor launch? Is there a quality issue? Did marketing campaigns underperform? Early detection means faster fixes.
Revenue enables better decisions. When you know which products, channels, and campaigns drive revenue, you allocate resources smarter. Double down on what works. Cut what doesn't.
Revenue should be easy to track. In 2025, manual calculations and spreadsheet gymnastics shouldn't be how you understand your business. Modern tools make revenue tracking automatic, accurate, and actionable.
For e-commerce and D2C brands especially, platforms like Spur don't just track revenue across channels. They actively help increase it through automated abandoned cart recovery, WhatsApp broadcasts, Instagram engagement, and AI-powered customer support. Brands like Eves & Gray and Muffynn achieved 88.75x and 73x ROI respectively using Spur's automated messaging tools.
Sales revenue is the starting line, not the finish. Calculate it accurately, track it consistently, and use those insights to build the business you want. And if you're ready to automate the entire process while simultaneously increasing that revenue, try Spur free for 7 days and see the difference unified, automated customer engagement makes.