
Top Customer Service Performance Indicators to Boost Results

Discuss with AI
Get instant insights and ask questions about this topic with AI assistants.
💡 Pro tip: All options include context about this blog post. Feel free to modify the prompt to ask more specific questions!
Exceptional customer service is crucial for business success. Tracking the right customer service performance indicators (KPIs) reveals strengths and weaknesses, empowering you to deliver better experiences and drive growth. This guide details eight essential customer service performance indicators, offering actionable strategies and real-world examples to optimize your operations. Learn how to measure and improve crucial metrics like customer satisfaction, agent efficiency, and retention.
This comprehensive list covers:
- Customer Satisfaction Score (CSAT): Gauging immediate satisfaction after specific interactions.
- Net Promoter Score (NPS): Measuring customer loyalty and likelihood to recommend.
- First Call Resolution (FCR): Tracking the efficiency of resolving issues on the first contact.
- Average Response Time: Evaluating the speed of your customer service responses.
- Customer Effort Score (CES): Measuring how easy it is for customers to interact with your support.
- Agent Utilization Rate: Assessing agent productivity and workload management.
- Customer Retention Rate: Monitoring your ability to retain customers over time.
- Service Level Agreement (SLA) Compliance: Ensuring adherence to promised service standards.
By mastering these KPIs, you can transform your customer service from good to exceptional. Building a high-performing team is essential for achieving these goals, and to delve deeper into staffing strategies, consider reading more on Hire Customer Service Professionals. Each KPI will be explored in detail, providing clear calculation methods, industry benchmarks, and practical optimization tips. You'll learn how to leverage these metrics to improve customer loyalty, boost efficiency, and ultimately drive revenue growth in 2025 and beyond. Source: Hire Customer Service Professionals In Latam from Nearshore Business Solutions
Customer Satisfaction Score (CSAT) is the most common metric for gauging customer happiness. It directly measures customer satisfaction with a specific interaction or touchpoint. Typically, CSAT is collected through surveys immediately following an interaction, asking customers to rate their experience on a numerical scale (e.g., 1-5 or 1-10). This provides valuable real-time feedback on how well you meet expectations at various points in the customer journey. A high CSAT indicates strong customer satisfaction, bolstering loyalty and positive word-of-mouth referrals.

To effectively measure and improve your customer service, consider tracking key indicateurs performance commerciale alongside your CSAT. This broader perspective can reveal valuable connections between customer satisfaction and overall business performance. For a deeper understanding of CSAT and its role in customer service quality assurance, Learn more about CSAT and quality assurance.
- Amazon: Their post-purchase rating system consistently achieves high CSAT scores, often above 85%, demonstrating the effectiveness of soliciting immediate feedback.
- Apple Store: In-store iPad-based feedback stations help maintain satisfaction levels exceeding 90%, showing the value of capturing feedback at the point of experience.
- Zappos: The company leverages CSAT to maintain its stellar reputation for customer service, proving the metric's importance for brand building.
- Southwest Airlines: Tracking CSAT across all touchpoints contributes to their industry-leading customer satisfaction, highlighting the benefits of a holistic approach.
- Timely Feedback Collection: Ask for feedback immediately after the interaction while the experience is fresh in the customer's mind.
- Brevity is Key: Keep surveys short (1-3 questions maximum) to maximize completion rates.
- Contextual Insights: Include an open-ended question to gather qualitative data and understand the "why" behind the rating.
- Automated Alerts: Set up alerts for low scores to enable quick intervention and service recovery.
- Proactive Feedback Solicitation: Train staff to actively encourage customers to provide feedback.
- Consistent Scaling: Use the same rating scale across all touchpoints to ensure data comparability and accurate trend analysis.
CSAT provides invaluable insights into specific customer interactions. By optimizing your CSAT program, you can identify areas for improvement, enhance customer experiences, and ultimately drive customer loyalty and business growth. This crucial customer service performance indicator allows businesses to respond proactively to customer feedback and build stronger relationships.
Net Promoter Score (NPS) gauges customer loyalty and their likelihood to recommend your business. It asks customers a simple question: "On a scale of 0-10, how likely are you to recommend [your company] to a friend or colleague?" Based on their responses, customers are categorized into three groups: Promoters (9-10), Passives (7-8), and Detractors (0-6). The NPS is calculated by subtracting the percentage of Detractors from the percentage of Promoters, resulting in a score between -100 and +100. A higher NPS generally correlates with stronger customer loyalty, positive word-of-mouth referrals, and business growth.

NPS provides a valuable overview of customer sentiment towards your brand. Tracking NPS over time helps identify trends and measure the impact of customer experience initiatives. Understanding your NPS helps prioritize areas for improvement and allocate resources effectively. It offers a crucial lens into customer loyalty and advocacy, serving as a key customer service performance indicator.
- Apple: Consistently achieving NPS scores of 70+ demonstrates the power of a strong brand and positive customer experiences.
- Tesla: Maintaining NPS scores above 90 in the competitive automotive industry highlights the impact of exceptional product quality and service.
- Netflix: Uses NPS to guide content creation and platform development, demonstrating the metric's value for strategic decision-making.
- Costco: Leverages its high NPS (75+) to drive membership growth and reinforce its value proposition.
- Follow Up: Include an open-ended question after the rating to understand the reasoning behind the score.
- Consistency: Survey customers at regular intervals to track progress and identify trends.
- Focus on Passives: Implement strategies to convert Passives into Promoters by addressing their concerns and exceeding expectations.
- Address Detractors: Act quickly on Detractor feedback to resolve issues and mitigate negative word-of-mouth.
- Segmentation: Analyze NPS by customer demographics and journey stages to identify specific areas for improvement.
- Team Training: Educate your teams on how their actions directly influence NPS and empower them to enhance the customer experience.
NPS provides a powerful metric for understanding customer loyalty and advocacy. By implementing these tips and actively monitoring your NPS, you can build stronger customer relationships, improve customer retention, and fuel business growth. This vital customer service performance indicator enables businesses to track customer sentiment and proactively address areas impacting loyalty.
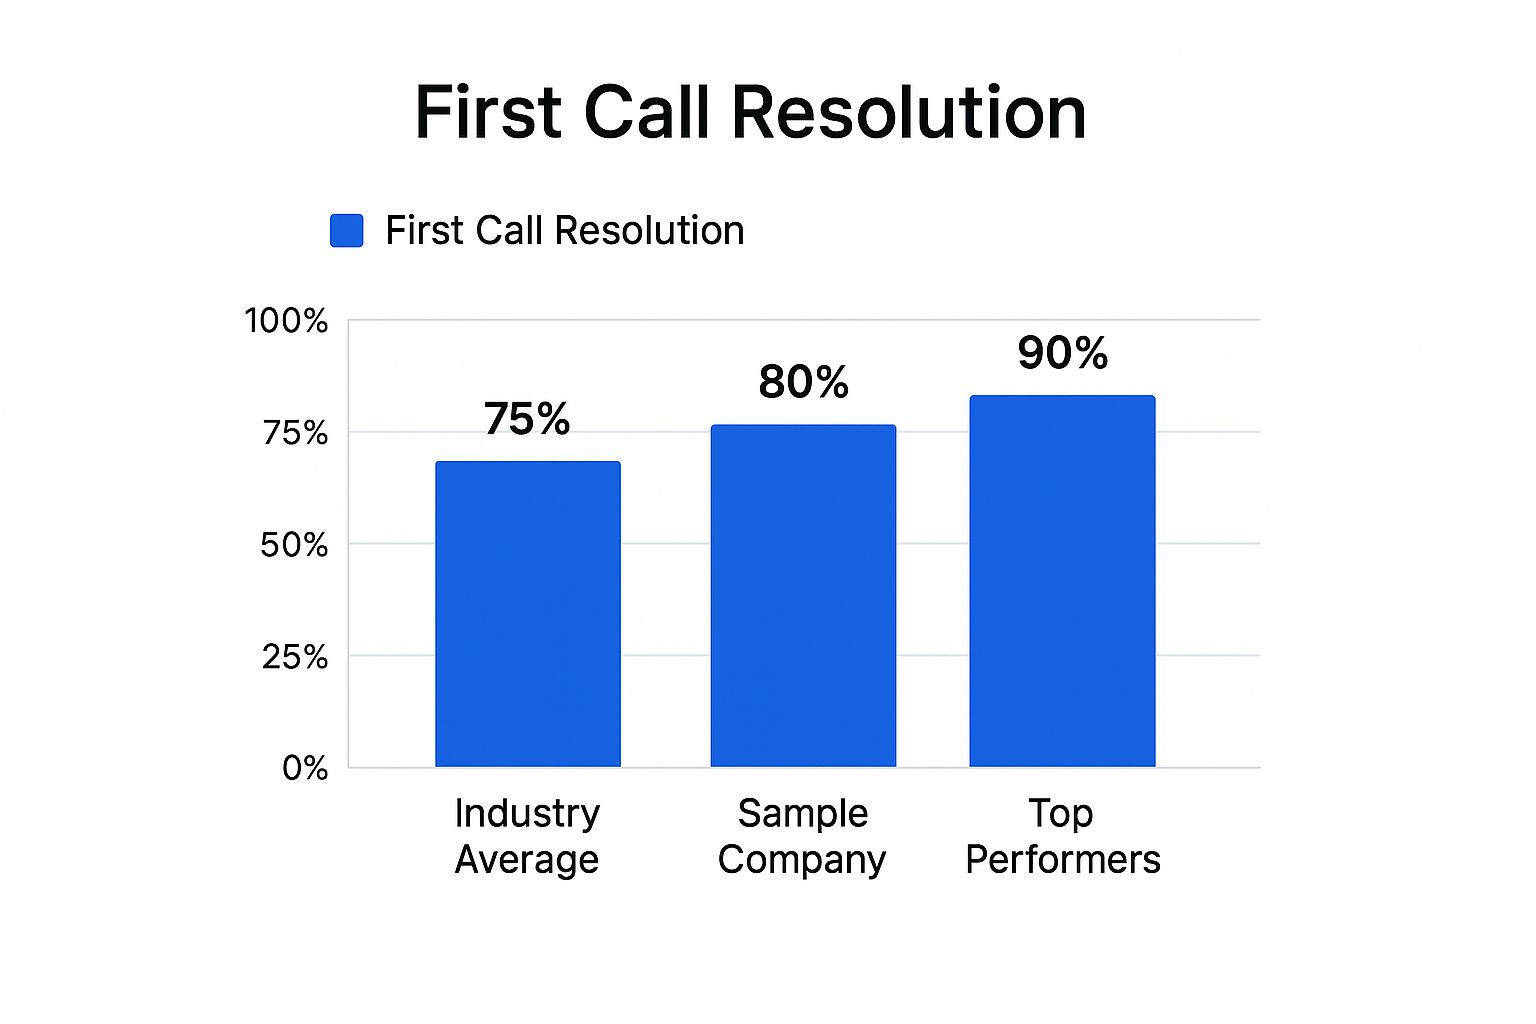
First Call Resolution (FCR) measures the percentage of customer issues resolved during the initial contact, eliminating the need for follow-up calls, emails, or any further interactions. It's a critical customer service performance indicator because it directly impacts both customer satisfaction and operational efficiency. By resolving issues quickly and effectively, businesses reduce costs associated with handling repeat contacts while simultaneously enhancing the customer experience. A high FCR demonstrates efficiency and competence, leading to increased customer loyalty and positive word-of-mouth referrals.
The following bar chart compares First Call Resolution rates across the industry average, a sample company, and top-performing organizations. As the chart illustrates, top performers achieve significantly higher FCR rates, highlighting the potential for improvement in most organizations.
- American Express: Achieves an FCR of over 85% by investing heavily in comprehensive agent training programs.
- Dell: Improved its technical support FCR from 60% to 80% through enhanced knowledge base resources for agents.
- USAA: Maintains an impressive FCR above 90% with specialized agent training and seamless integration of customer data.
- Best Buy's Geek Squad: Optimizes its FCR through the use of remote diagnostic tools, enabling quicker issue resolution.
- Invest in Training: Comprehensive agent training and robust knowledge bases empower agents to resolve issues efficiently.
- Smart Routing: Implement intelligent routing systems to connect customers with specialized agents best suited to handle their specific issues.
- Provide Context: Equip agents with complete customer history and context to avoid repetitive questioning and streamline the resolution process.
- Verify Resolution: Conduct regular follow-up surveys to confirm issue resolution and identify any lingering problems.
- Root Cause Analysis: Analyze recurring issues to address underlying causes and prevent future occurrences.
- Balance with Quality: While striving for high FCR, ensure that resolution quality is not compromised.
FCR offers crucial insights into the efficiency and effectiveness of your customer service operations. By implementing these strategies and continuously monitoring FCR performance, businesses can significantly enhance customer satisfaction, reduce operational costs, and drive overall business growth. This key performance indicator allows businesses to identify areas for improvement and streamline their customer service processes for optimal results.
Average Response Time measures how quickly customer service teams acknowledge and respond to customer inquiries across various channels. This metric is crucial for setting customer expectations and maintaining service level agreements (SLAs). Different communication channels, such as phone, email, chat, and social media, will have different benchmarks for acceptable response times. Monitoring and optimizing response times is essential for providing efficient and satisfactory customer service. A slow response can lead to customer frustration and negatively impact their perception of your brand.
To further explore best practices in customer service, learn more about Average Response Time and other strategies that can improve your overall customer experience.
- Zappos: Known for their exceptional customer service, Zappos aims to respond to all emails within 4 hours as part of their service promise. This commitment to timely communication builds trust and reinforces their customer-centric approach.
- Buffer: The social media management platform, Buffer, strives for a remarkable 5-minute average response time on social media. This rapid response demonstrates their dedication to real-time engagement and helps them build a strong online community.
- Amazon: Often setting the standard for customer service, Amazon's support teams frequently achieve sub-30-second phone response times. This immediate assistance resolves issues quickly and minimizes customer wait times.
- HubSpot: The marketing and sales software company, HubSpot, understands the importance of email communication. Their support team maintains a 12-hour email response average, ensuring timely resolution of customer queries.
- Set Channel-Specific Response Time Targets: Establish realistic and achievable response time goals for each communication channel based on industry best practices and customer expectations.
- Use Auto-Acknowledgment: Implement automated responses to acknowledge receipt of inquiries and manage customer expectations regarding when they can expect a full response.
- Implement Intelligent Routing: Use technology to route inquiries to the most appropriate specialist, ensuring quicker resolution times and reducing internal transfers.
- Monitor Response Times by Time of Day and Day of Week: Analyze response time data to identify peak periods and adjust staffing levels accordingly to maintain consistent service levels.
- Balance Speed with Quality Metrics: While speed is important, prioritize providing accurate and helpful responses. Monitor metrics like First Contact Resolution alongside response time to ensure quality isn't sacrificed for speed.
- Communicate Response Time Expectations Clearly to Customers: Be transparent about expected response times for each channel. Setting clear expectations manages customer frustration and promotes a positive experience.
Average Response Time is a crucial customer service performance indicator that directly impacts customer satisfaction. By optimizing your response times, you demonstrate a commitment to customer needs, build stronger relationships, and ultimately drive customer loyalty and business growth. This focus on efficient communication can significantly enhance the customer experience and set your brand apart from the competition.
Customer Effort Score (CES) measures how easily customers can resolve their issues or achieve their desired outcomes. Unlike metrics focused on delight, CES recognizes that customers primarily value seamless experiences. It typically involves asking customers to rate their agreement with a statement like, "The company made it easy for me to handle my issue," on a scale of 1-7 (1 being strongly disagree, 7 being strongly agree). This direct feedback pinpoints friction points within the customer journey, enabling targeted improvements to streamline processes and enhance customer satisfaction. A low CES indicates a smooth, effortless experience, leading to increased customer loyalty and positive word-of-mouth referrals.

- Netflix: By leveraging CES feedback, Netflix optimizes its platform to simplify search functionality and content discovery, reducing customer effort.
- Amazon: The one-click ordering system epitomizes minimizing customer effort, contributing to Amazon's exceptional customer experience.
- Progressive Insurance: Streamlined claims processes have enabled Progressive to achieve consistently low CES scores, demonstrating the effectiveness of simplifying complex procedures.
- Uber: The app's intuitive design, focusing on minimal steps to book rides, showcases how CES principles can drive user-friendly design and enhance customer satisfaction.
- Focus on Simplicity: Reduce steps and complexity in all customer-facing processes.
- Journey Mapping: Map the entire customer journey to identify high-effort touchpoints.
- Holistic Approach: Use CES alongside other customer service performance indicators for a comprehensive understanding of customer experience.
- Proactive Support: Train agents to anticipate and proactively reduce customer effort during interactions.
- Continuous Improvement: Regularly review and simplify customer-facing processes based on CES feedback.
- Follow-Up Action: Address high CES scores promptly by implementing process improvements and following up with affected customers.
CES offers valuable insights into the ease of customer interactions. By optimizing your CES program and prioritizing simplicity, you can identify friction points, enhance customer experiences, and cultivate stronger customer relationships, leading to increased loyalty and business growth. This crucial customer service performance indicator empowers businesses to create truly effortless experiences that resonate with today's customers.
Agent Utilization Rate measures the percentage of time customer service agents spend actively handling customer interactions versus their total available working time. This key customer service performance indicator helps organizations optimize staffing levels, identify training needs, and ensure efficient resource allocation while maintaining service quality standards. It provides valuable insights into operational efficiency and helps balance workload with agent well-being. A high utilization rate can indicate efficient staffing, while a low rate may suggest overstaffing or inefficient processes.
- Call Center Operations: Many call centers target a utilization rate of 80-85% to achieve an optimal balance between agent productivity and avoiding burnout. This ensures efficient resource allocation while maintaining reasonable workloads.
- Salesforce: Salesforce integrates utilization data into its platform, allowing businesses to optimize agent schedules based on real-time interaction patterns. This dynamic approach maximizes efficiency and responsiveness.
- Teleperformance: Global customer experience management company Teleperformance uses utilization data to improve workforce planning and forecasting. This ensures they have the right number of agents available at the right times.
- LiveWorld: For social media customer service, LiveWorld balances agent utilization with quality and customer satisfaction metrics. This ensures efficient handling of social interactions while maintaining brand reputation.
- Target Range: Aim for a utilization rate of 75-85% to balance productivity and agent well-being. Rates consistently above this range can lead to burnout and reduced service quality.
- Balanced Metrics: Don't focus solely on utilization. Balance it with other customer service performance indicators like Customer Satisfaction (CSAT) and First Response Time to ensure a holistic approach to service quality.
- Adequate Downtime: Provide agents with sufficient break time and after-call work periods to avoid fatigue and maintain performance. This is crucial for sustained efficiency.
- Training Needs Identification: Use utilization data to identify agents who may require additional training or support. Lower than average utilization can sometimes indicate skill gaps.
- Varied Targets: Consider different utilization targets for various support channels (e.g., phone, email, chat) due to varying interaction complexities. This allows for more nuanced performance management.
- Predictive Staffing: Monitor utilization trends to predict staffing needs and proactively adjust schedules to meet fluctuating demand. This ensures consistent service levels.
Agent Utilization Rate provides crucial insights into operational efficiency and agent performance. By optimizing this customer service performance indicator, organizations can improve resource allocation, enhance agent productivity, and ultimately deliver a better customer experience. Striking the right balance between utilization and agent well-being is essential for long-term success.
Customer Retention Rate measures the percentage of customers who continue doing business with a company over a specific period. This key customer service performance indicator reveals the effectiveness of your efforts in fostering loyalty and building strong customer relationships. It reflects the cumulative impact of all customer interactions and experiences, providing a valuable long-term view of customer service success. A high retention rate signifies strong customer satisfaction, effective service delivery, and ultimately, sustainable business growth.
To enhance your understanding of customer retention strategies, Learn more about retention marketing with WhatsApp. This resource provides valuable insights into leveraging communication platforms for improved customer engagement and retention.
- Amazon Prime: Achieves a 90%+ annual retention rate through superior service, personalized recommendations, and exclusive benefits, demonstrating the power of a comprehensive customer-centric approach.
- Apple: Maintains 85%+ retention rates across product lines by fostering a loyal customer base through exceptional product quality, seamless user experience, and dedicated customer support.
- Costco: Their membership retention exceeds 90% globally, highlighting the effectiveness of a value-driven approach combined with excellent customer service.
- Netflix: Maintains 80%+ retention despite increased competition by continuously adapting to evolving customer preferences and providing a vast library of content.
- Segmented Tracking: Track retention by customer segments and service tiers to identify specific areas for improvement and tailor strategies accordingly.
- Churn Prediction: Identify early warning signs of customer churn through behavioral analysis and proactive customer feedback collection.
- Proactive Outreach: Implement proactive outreach programs for at-risk customers to address concerns and prevent churn.
- Onboarding Focus: Optimize the onboarding experience to improve early retention and set the stage for long-term customer loyalty.
- Data-Driven Improvements: Use retention data to inform service improvement priorities and allocate resources effectively.
- Analyze High-Retention Customers: Celebrate and analyze the characteristics of high-retention customers to replicate successful strategies and further enhance customer loyalty.
Customer Retention Rate is a crucial customer service performance indicator that provides a valuable long-term perspective on customer loyalty and business sustainability. By focusing on retention strategies, businesses can build stronger customer relationships, reduce churn, and drive sustainable growth. Optimizing your retention program is an essential investment in the long-term health and profitability of your business.
Service Level Agreement (SLA) Compliance measures how well customer service teams meet predefined service standards and commitments made to customers. These agreements typically include response times, resolution times, availability, and quality standards. High SLA compliance indicates reliable, consistent service delivery and helps build customer trust and satisfaction. Meeting these commitments demonstrates a commitment to customer needs and strengthens the overall customer relationship. Failing to meet them, however, can quickly erode trust and damage your brand reputation.
- Amazon Web Services (AWS): AWS maintains a 99.9% uptime SLA with automatic credits for failures, demonstrating their commitment to reliability and service availability. This transparency and proactive compensation build customer confidence.
- Zendesk: Zendesk achieves high SLA compliance across its customer support operations, often exceeding 99.5%, showcasing the effectiveness of streamlined workflows and efficient resource allocation. This consistency reinforces their position as a reliable support platform.
- Microsoft: Microsoft's enterprise support maintains response time SLAs by severity level, prioritizing critical issues and ensuring timely resolution. This tiered approach ensures efficient handling of various support requests.
- Salesforce Service Cloud: Salesforce Service Cloud provides tools to help companies track and improve SLA compliance, emphasizing the importance of utilizing technology to manage and optimize service delivery. These tools offer valuable insights into performance and areas for improvement.
- Set Realistic Targets: Establish achievable SLA targets based on historical data and industry benchmarks. Avoid setting unrealistic expectations that could strain resources and demoralize your team. High employee turnover can significantly impact key customer service metrics. To understand the financial implications, explore the cost of employee turnover.
- Regular Review and Adjustment: Periodically review and adjust SLAs based on performance, customer feedback, and evolving business needs. This ensures SLAs remain relevant and effective.
- Escalation Procedures: Implement clear escalation procedures for SLA breaches to ensure prompt action and minimize negative impact on customers.
- Data-Driven Improvements: Use SLA data to identify areas for training, process improvement, and resource allocation optimization. This allows you to proactively address performance gaps.
- Transparent Communication: Communicate SLA performance transparently to customers to build trust and manage expectations.
- Balanced Approach: Balance SLA compliance with other crucial customer service performance indicators like customer satisfaction (CSAT) to ensure a holistic approach.
SLA compliance is a crucial customer service performance indicator that reflects your commitment to providing reliable and consistent service. By optimizing your SLA program, you can enhance customer trust, improve service delivery, and strengthen your brand reputation. This metric offers a tangible measure of your service quality and helps drive continuous improvement within your customer support operations.
Metric Implementation Complexity 🔄 Resource Requirements ⚡ Expected Outcomes 📊 Ideal Use Cases 💡 Key Advantages ⭐ Customer Satisfaction Score (CSAT) Low - simple surveys Low - minimal tools needed Immediate feedback on specific interactions Quick feedback on service touchpoints Easy to understand, actionable, industry standard Net Promoter Score (NPS) Low to moderate - single question Low - survey plus follow-up analysis Measures customer loyalty and advocacy Tracking loyalty and word-of-mouth potential Strong growth correlation, predictive of retention First Call Resolution (FCR) Moderate - requires tracking systems Moderate to high - requires data systems Higher customer satisfaction and efficiency Reducing repeat contacts, operational cost control Reduces effort and costs, strong satisfaction predictor Average Response Time Moderate - channel-specific tracking Moderate - tools for multi-channel Faster response times, SLA compliance Managing response speed across communication channels Direct impact on satisfaction, identifies bottlenecks Customer Effort Score (CES) Low to moderate - focused surveys Low - focused survey design Insights on friction points, loyalty predictor Improving ease of customer interactions Predicts loyalty, highlights process pain points Agent Utilization Rate Moderate - time tracking required Moderate - workforce management tools Optimized staffing and efficiency Workforce planning and performance management Improves resource allocation, identifies coaching need Customer Retention Rate Low - based on existing customer data Low to moderate - CRM required Measures long-term loyalty and revenue impact Long-term customer value and business growth Reflects cumulative service impact, business stability SLA Compliance Moderate - requires detailed tracking Moderate to high - monitoring systems Reliable service delivery and accountability Meeting contractual service standards Builds trust, clear performance standards
This article explored eight crucial customer service performance indicators (customer service KPIs) that provide a comprehensive view of your customer service effectiveness. From understanding customer satisfaction (CSAT) and loyalty (NPS) to optimizing efficiency metrics like First Call Resolution (FCR) and Average Response Time, these KPIs offer valuable data for driving improvement. We also delved into Customer Effort Score (CES), Agent Utilization Rate, Customer Retention Rate, and Service Level Agreement (SLA) compliance, highlighting their significance in achieving customer service excellence.
Mastering these customer service KPIs is paramount for any business striving for growth and customer loyalty. By analyzing these metrics, you can identify areas for improvement, optimize processes, and create a truly customer-centric culture. This translates to increased customer retention, positive word-of-mouth referrals, and ultimately, a stronger brand reputation.
- Focus on the Customer: Prioritize metrics like CSAT, NPS, and CES to ensure your service meets customer expectations and builds loyalty.
- Optimize for Efficiency: Metrics like FCR, Average Response Time, and Agent Utilization Rate reveal opportunities to streamline processes and improve efficiency.
- Data-Driven Decisions: Regularly monitoring these KPIs provides the insights needed to make informed decisions and implement targeted improvements.
Implementing these customer service KPIs effectively requires a strategic approach. Start by selecting the metrics most relevant to your business goals. Then, establish clear benchmarks and track your progress consistently. Regularly review your data, identify trends, and adjust your strategies accordingly. Finally, empower your team with the tools and training they need to deliver exceptional customer experiences.
Investing in optimizing your customer service performance indicators yields significant returns. Improved customer satisfaction leads to increased customer lifetime value, reduced churn, and enhanced brand advocacy. A positive customer experience creates a ripple effect, driving business growth and establishing a competitive advantage.
By actively measuring, analyzing, and optimizing these KPIs, you're not just improving customer service; you're investing in the future of your business. You're building a foundation of customer loyalty that will propel your brand forward and solidify your position in the market.
Ready to elevate your customer service performance and unlock the full potential of your customer experience? Spur empowers you to automate tasks, gather real-time data on essential customer service KPIs, and streamline your operations for enhanced efficiency and increased customer satisfaction. Visit Spur today and discover how you can transform your customer service operations.